Statistik Dasar
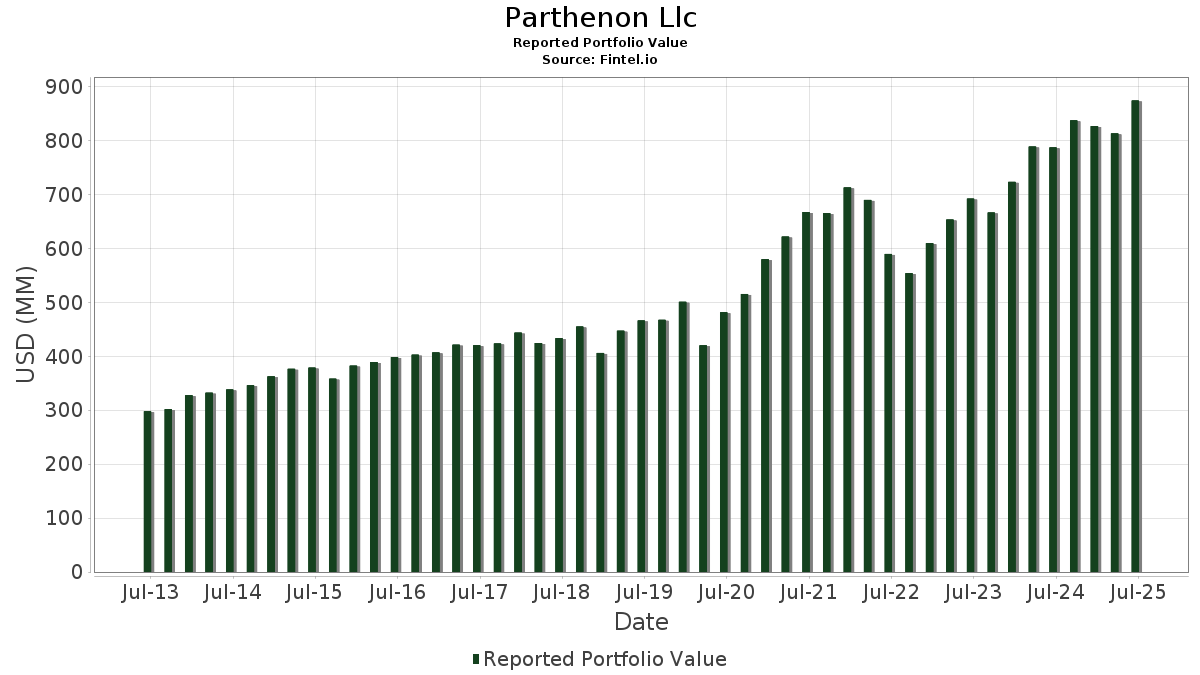
| Nilai Portofolio | $ 874.139.888 |
| Posisi Saat Ini | 126 |
Kepemilikan Terbaru, Kinerja, AUM (dari 13F, 13D)
Parthenon Llc telah diungkapkan 126 total kepemilikan dalam pengajuan SEC terbaru mereka. Nilai portofolio terbaru dihitung sebesar $ 874.139.888 USD. Aset yang dikelola (AUM) Aktual adalah nilai ini ditambah uang tunai (yang tidak diungkapkan). Kepemilikan teratas Parthenon Llc adalah Microsoft Corporation (US:MSFT) , Berkshire Hathaway Inc. (US:BRK.B) , Meta Platforms, Inc. (US:META) , Paychex, Inc. (US:PAYX) , and Alphabet Inc. (US:GOOGL) . Posisi baru Parthenon Llc meliputi ICON Public Limited Company (US:ICLR) , .
Peningkatan Teratas pada Kuartal Ini
Kami menggunakan perubahan alokasi portofolio karena ini adalah metrik yang paling berarti. Perubahan bisa disebabkan oleh perdagangan atau perubahan harga saham.
| Keamanan | Saham (MM) |
Nilai (MM$) |
Portofolio % | ΔPortofolio % |
|---|---|---|---|---|
| 0,24 | 120,66 | 13,8031 | 2,4081 | |
| 0,06 | 9,01 | 1,0311 | 1,0311 | |
| 0,07 | 52,85 | 6,0464 | 0,9413 | |
| 0,16 | 7,40 | 0,8469 | 0,4216 | |
| 0,00 | 20,57 | 2,3537 | 0,3289 | |
| 0,07 | 22,20 | 2,5392 | 0,2390 | |
| 0,17 | 29,40 | 3,3632 | 0,1937 | |
| 0,08 | 9,30 | 1,0644 | 0,1626 | |
| 0,14 | 24,52 | 2,8049 | 0,1370 | |
| 0,04 | 12,44 | 1,4227 | 0,1312 |
Penurunan Teratas pada Kuartal Ini
Kami menggunakan perubahan alokasi portofolio karena ini adalah metrik yang paling berarti. Perubahan bisa disebabkan oleh perdagangan atau perubahan harga saham.
| Keamanan | Saham (MM) |
Nilai (MM$) |
Portofolio % | ΔPortofolio % |
|---|---|---|---|---|
| 0,14 | 69,12 | 7,9070 | -1,4361 | |
| 0,25 | 36,35 | 4,1585 | -0,6781 | |
| 0,13 | 27,10 | 3,0999 | -0,4909 | |
| 0,19 | 20,04 | 2,2931 | -0,4785 | |
| 0,14 | 22,88 | 2,6173 | -0,4300 | |
| 0,12 | 19,02 | 2,1764 | -0,3731 | |
| 0,10 | 13,41 | 1,5342 | -0,3168 | |
| 0,16 | 12,37 | 1,4151 | -0,3065 | |
| 0,03 | 11,08 | 1,2670 | -0,2100 | |
| 0,07 | 9,37 | 1,0718 | -0,1782 |
13F dan Pengajuan Dana
Formulir ini diajukan pada tanggal 2025-07-29 untuk periode pelaporan 2025-06-30. Klik ikon tautan untuk melihat riwayat transaksi selengkapnya.
Tingkatkan untuk membuka data premium dan mengekspor ke Excel ![]() .
.
| Keamanan | Jenis | Rata-rata Harga Saham | Saham (MM) |
ΔSaham (%) |
ΔSaham (%) |
Nilai ($MM) |
Portofolio (%) |
ΔPortofolio (%) |
|
|---|---|---|---|---|---|---|---|---|---|
| MSFT / Microsoft Corporation | 0,24 | -1,73 | 120,66 | 30,22 | 13,8031 | 2,4081 | |||
| BRK.B / Berkshire Hathaway Inc. | 0,14 | -0,26 | 69,12 | -9,02 | 7,9070 | -1,4361 | |||
| META / Meta Platforms, Inc. | 0,07 | -0,58 | 52,85 | 27,32 | 6,0464 | 0,9413 | |||
| PAYX / Paychex, Inc. | 0,25 | -1,97 | 36,35 | -7,57 | 4,1585 | -0,6781 | |||
| GOOGL / Alphabet Inc. | 0,17 | 0,10 | 29,40 | 14,07 | 3,3632 | 0,1937 | |||
| AAPL / Apple Inc. | 0,13 | 0,48 | 27,10 | -7,20 | 3,0999 | -0,4909 | |||
| GOOG / Alphabet Inc. | 0,14 | -0,46 | 24,52 | 13,02 | 2,8049 | 0,1370 | |||
| PG / The Procter & Gamble Company | 0,14 | -1,23 | 22,88 | -7,67 | 2,6173 | -0,4300 | |||
| FAST / Fastenal Company | 0,54 | 99,62 | 22,76 | 8,12 | 2,6042 | 0,0147 | |||
| WMT / Walmart Inc. | 0,23 | -0,29 | 22,56 | 11,06 | 2,5807 | 0,0825 | |||
| AXP / American Express Company | 0,07 | 0,09 | 22,20 | 18,67 | 2,5392 | 0,2390 | |||
| BKNG / Booking Holdings Inc. | 0,00 | -0,56 | 20,57 | 24,96 | 2,3537 | 0,3289 | |||
| XOM / Exxon Mobil Corporation | 0,19 | -1,88 | 20,04 | -11,06 | 2,2931 | -0,4785 | |||
| DOV / Dover Corporation | 0,11 | 0,39 | 19,67 | 4,71 | 2,2499 | -0,0601 | |||
| JNJ / Johnson & Johnson | 0,12 | -0,37 | 19,02 | -8,23 | 2,1764 | -0,3731 | |||
| SYK / Stryker Corporation | 0,04 | -0,03 | 15,19 | 6,26 | 1,7382 | -0,0204 | |||
| CSCO / Cisco Systems, Inc. | 0,20 | -1,73 | 13,91 | 10,48 | 1,5914 | 0,0429 | |||
| PEP / PepsiCo, Inc. | 0,10 | 1,18 | 13,41 | -10,90 | 1,5342 | -0,3168 | |||
| SCHW / The Charles Schwab Corporation | 0,14 | -0,35 | 12,85 | 16,15 | 1,4697 | 0,1094 | |||
| GLW / Corning Incorporated | 0,24 | -0,61 | 12,81 | 14,17 | 1,4654 | 0,0856 | |||
| JPM / JPMorgan Chase & Co. | 0,04 | 0,20 | 12,44 | 18,42 | 1,4227 | 0,1312 | |||
| MRK / Merck & Co., Inc. | 0,16 | 0,19 | 12,37 | -11,64 | 1,4151 | -0,3065 | |||
| MDLZ / Mondelez International, Inc. | 0,17 | -1,03 | 11,21 | -1,62 | 1,2823 | -0,1190 | |||
| WAT / Waters Corporation | 0,03 | -2,62 | 11,08 | -7,79 | 1,2670 | -0,2100 | |||
| LSTR / Landstar System, Inc. | 0,07 | -0,41 | 9,37 | -7,83 | 1,0718 | -0,1782 | |||
| DIS / The Walt Disney Company | 0,08 | 0,98 | 9,30 | 26,86 | 1,0644 | 0,1626 | |||
| CVS / CVS Health Corporation | 0,13 | -6,07 | 9,19 | -4,37 | 1,0514 | -0,1305 | |||
| ICLR / ICON Public Limited Company | 0,06 | 9,01 | 1,0311 | 1,0311 | |||||
| HD / The Home Depot, Inc. | 0,02 | -1,29 | 8,52 | -1,25 | 0,9751 | -0,0864 | |||
| VOO / Vanguard Index Funds - Vanguard S&P 500 ETF | 0,01 | 1,93 | 8,14 | 12,66 | 0,9315 | 0,0427 | |||
| MDT / Medtronic plc | 0,09 | -3,00 | 7,60 | -5,90 | 0,8699 | -0,1240 | |||
| BATRK / Atlanta Braves Holdings, Inc. | 0,16 | 83,13 | 7,40 | 114,08 | 0,8469 | 0,4216 | |||
| CHDN / Churchill Downs Incorporated | 0,07 | 0,00 | 7,38 | -9,07 | 0,8445 | -0,1539 | |||
| YETI / YETI Holdings, Inc. | 0,22 | 0,95 | 7,04 | -3,88 | 0,8053 | -0,0953 | |||
| PNC / The PNC Financial Services Group, Inc. | 0,03 | 0,00 | 6,23 | 6,06 | 0,7128 | -0,0097 | |||
| GE / General Electric Company | 0,02 | 0,00 | 5,87 | 28,60 | 0,6718 | 0,1102 | |||
| VERSX / Vanguard Emerging Markets Stock Index Fund | 0,12 | 1,07 | 5,70 | 10,45 | 0,6518 | 0,0174 | |||
| IJR / iShares Trust - iShares Core S&P Small-Cap ETF | 0,05 | 1,34 | 5,68 | 5,91 | 0,6502 | -0,0097 | |||
| PM / Philip Morris International Inc. | 0,03 | 0,00 | 5,31 | 14,75 | 0,6072 | 0,0383 | |||
| BRK.A / Berkshire Hathaway Inc. | 0,00 | 0,00 | 5,10 | -8,73 | 0,5836 | -0,1037 | |||
| VEA / Vanguard Tax-Managed Funds - Vanguard FTSE Developed Markets ETF | 0,08 | 0,86 | 4,68 | 13,12 | 0,5358 | 0,0266 | |||
| KO / The Coca-Cola Company | 0,06 | -4,36 | 4,41 | -5,51 | 0,5045 | -0,0695 | |||
| MCD / McDonald's Corporation | 0,01 | 0,00 | 4,23 | -6,46 | 0,4835 | -0,0722 | |||
| SJM / The J. M. Smucker Company | 0,04 | -0,62 | 4,16 | -17,58 | 0,4763 | -0,1450 | |||
| HSY / The Hershey Company | 0,02 | -0,61 | 4,07 | -3,56 | 0,4654 | -0,0534 | |||
| ABT / Abbott Laboratories | 0,03 | 0,00 | 4,02 | 2,52 | 0,4600 | -0,0223 | |||
| LLY / Eli Lilly and Company | 0,01 | 0,99 | 3,97 | -4,68 | 0,4541 | -0,0580 | |||
| ABBV / AbbVie Inc. | 0,02 | -2,32 | 3,92 | -13,46 | 0,4480 | -0,1085 | |||
| NVDA / NVIDIA Corporation | 0,02 | 0,83 | 3,82 | 47,01 | 0,4364 | 0,1172 | |||
| TPB / Turning Point Brands, Inc. | 0,05 | 0,00 | 3,70 | 27,50 | 0,4227 | 0,0662 | |||
| MO / Altria Group, Inc. | 0,05 | 0,00 | 2,89 | -2,30 | 0,3308 | -0,0332 | |||
| BFB / Brown-Forman Corp. - Class B | 0,10 | 0,00 | 2,80 | -20,71 | 0,3203 | -0,1140 | |||
| VPL / Vanguard International Equity Index Funds - Vanguard FTSE Pacific ETF | 0,03 | -0,60 | 2,71 | 12,72 | 0,3102 | 0,0144 | |||
| CL / Colgate-Palmolive Company | 0,03 | 0,00 | 2,50 | -2,99 | 0,2858 | -0,0309 | |||
| IBM / International Business Machines Corporation | 0,01 | -9,88 | 2,48 | 6,85 | 0,2839 | -0,0018 | |||
| PFE / Pfizer Inc. | 0,09 | -2,15 | 2,28 | -6,37 | 0,2607 | -0,0387 | |||
| SMG / The Scotts Miracle-Gro Company | 0,03 | -15,66 | 2,14 | 1,38 | 0,2445 | -0,0148 | |||
| GEV / GE Vernova Inc. | 0,00 | -0,54 | 2,04 | 72,38 | 0,2335 | 0,0879 | |||
| NKE / NIKE, Inc. | 0,03 | 2,98 | 1,92 | 15,28 | 0,2201 | 0,0148 | |||
| KVUE / Kenvue Inc. | 0,09 | -21,64 | 1,85 | -31,62 | 0,2116 | -0,1210 | |||
| THRY / Thryv Holdings, Inc. | 0,15 | 19,89 | 1,83 | 13,86 | 0,2096 | 0,0116 | |||
| IVV / iShares Trust - iShares Core S&P 500 ETF | 0,00 | 0,00 | 1,82 | 10,48 | 0,2086 | 0,0057 | |||
| VGK / Vanguard International Equity Index Funds - Vanguard FTSE Europe ETF | 0,02 | 0,00 | 1,74 | 10,43 | 0,1986 | 0,0052 | |||
| CVX / Chevron Corporation | 0,01 | 0,00 | 1,68 | -14,39 | 0,1920 | -0,0491 | |||
| VTI / Vanguard Index Funds - Vanguard Total Stock Market ETF | 0,01 | 2,91 | 1,62 | 13,81 | 0,1857 | 0,0103 | |||
| ORCL / Oracle Corporation | 0,01 | 1,50 | 1,56 | 58,72 | 0,1782 | 0,0575 | |||
| CLAR / Clarus Corporation | 0,44 | 32,75 | 1,52 | 22,88 | 0,1739 | 0,0217 | |||
| ZTS / Zoetis Inc. | 0,01 | 0,80 | 1,48 | -4,52 | 0,1692 | -0,0213 | |||
| ADP / Automatic Data Processing, Inc. | 0,00 | 0,00 | 1,45 | 0,98 | 0,1658 | -0,0108 | |||
| USB / U.S. Bancorp | 0,03 | -6,58 | 1,45 | 0,14 | 0,1655 | -0,0122 | |||
| BSX / Boston Scientific Corporation | 0,01 | 0,00 | 1,41 | 6,50 | 0,1614 | -0,0016 | |||
| TFX / Teleflex Incorporated | 0,01 | 0,00 | 1,41 | -14,35 | 0,1612 | -0,0411 | |||
| SPY / SPDR S&P 500 ETF | 0,00 | -1,77 | 1,38 | 8,52 | 0,1573 | 0,0015 | |||
| INTU / Intuit Inc. | 0,00 | 0,00 | 1,32 | 28,31 | 0,1509 | 0,0244 | |||
| RELL / Richardson Electronics, Ltd. | 0,13 | 0,00 | 1,30 | -13,48 | 0,1483 | -0,0361 | |||
| COST / Costco Wholesale Corporation | 0,00 | 2,04 | 1,24 | 6,80 | 0,1419 | -0,0009 | |||
| VEU / Vanguard International Equity Index Funds - Vanguard FTSE All-World ex-US ETF | 0,02 | -3,16 | 1,24 | 7,38 | 0,1415 | -0,0002 | |||
| MMM / 3M Company | 0,01 | -0,01 | 1,22 | 3,64 | 0,1400 | -0,0052 | |||
| RSSS / Research Solutions, Inc. | 0,39 | 0,00 | 1,13 | 10,40 | 0,1288 | 0,0034 | |||
| IWM / iShares Trust - iShares Russell 2000 ETF | 0,00 | -2,06 | 1,02 | 6,00 | 0,1172 | -0,0017 | |||
| IWR / iShares Trust - iShares Russell Mid-Cap ETF | 0,01 | -5,62 | 0,90 | 2,05 | 0,1025 | -0,0055 | |||
| YUM / Yum! Brands, Inc. | 0,01 | 0,00 | 0,83 | -5,79 | 0,0950 | -0,0135 | |||
| JCTC / Jewett-Cameron Trading Company Ltd. | 0,22 | 0,00 | 0,81 | -18,78 | 0,0926 | -0,0299 | |||
| MSI / Motorola Solutions, Inc. | 0,00 | -21,70 | 0,71 | -24,84 | 0,0807 | -0,0347 | |||
| MA / Mastercard Incorporated | 0,00 | 0,00 | 0,70 | 2,50 | 0,0799 | -0,0039 | |||
| IWB / iShares Trust - iShares Russell 1000 ETF | 0,00 | 0,00 | 0,67 | 10,71 | 0,0769 | 0,0022 | |||
| LOW / Lowe's Companies, Inc. | 0,00 | 0,00 | 0,66 | -4,77 | 0,0754 | -0,0098 | |||
| V / Visa Inc. | 0,00 | 2,84 | 0,59 | 4,24 | 0,0675 | -0,0021 | |||
| WM / Waste Management, Inc. | 0,00 | 1,52 | 0,58 | 0,35 | 0,0664 | -0,0047 | |||
| USMV / iShares Trust - iShares MSCI USA Min Vol Factor ETF | 0,01 | 0,00 | 0,58 | 0,17 | 0,0663 | -0,0048 | |||
| IVW / iShares Trust - iShares S&P 500 Growth ETF | 0,01 | 0,00 | 0,57 | 18,70 | 0,0647 | 0,0061 | |||
| T / AT&T Inc. | 0,02 | 0,00 | 0,52 | 2,35 | 0,0599 | -0,0030 | |||
| WBA / Walgreens Boots Alliance, Inc. | 0,04 | -16,78 | 0,51 | -14,52 | 0,0586 | -0,0151 | |||
| ETN / Eaton Corporation plc | 0,00 | 0,00 | 0,51 | 31,27 | 0,0582 | 0,0106 | |||
| AMZN / Amazon.com, Inc. | 0,00 | 4,83 | 0,48 | 21,12 | 0,0545 | 0,0060 | |||
| BFA / Brown-Forman Corp. - Class A | 0,02 | 0,00 | 0,47 | -17,91 | 0,0541 | -0,0167 | |||
| COHR / Coherent Corp. | 0,01 | 0,00 | 0,45 | 37,16 | 0,0520 | 0,0113 | |||
| CINF / Cincinnati Financial Corporation | 0,00 | 0,00 | 0,45 | 0,68 | 0,0511 | -0,0034 | |||
| JBL / Jabil Inc. | 0,00 | 0,00 | 0,44 | 60,29 | 0,0499 | 0,0164 | |||
| XLK / The Select Sector SPDR Trust - The Technology Select Sector SPDR Fund | 0,00 | -2,94 | 0,42 | 18,80 | 0,0478 | 0,0046 | |||
| UG / United-Guardian, Inc. | 0,05 | 0,00 | 0,42 | -10,94 | 0,0475 | -0,0099 | |||
| TFC / Truist Financial Corporation | 0,01 | -0,47 | 0,39 | 3,99 | 0,0448 | -0,0015 | |||
| RTX / RTX Corporation | 0,00 | 0,00 | 0,35 | 10,28 | 0,0406 | 0,0010 | |||
| TSCO / Tractor Supply Company | 0,01 | 0,00 | 0,35 | -4,38 | 0,0400 | -0,0049 | |||
| AMGN / Amgen Inc. | 0,00 | 0,00 | 0,33 | -10,38 | 0,0376 | -0,0075 | |||
| ECL / Ecolab Inc. | 0,00 | 0,00 | 0,32 | 6,33 | 0,0365 | -0,0004 | |||
| MCK / McKesson Corporation | 0,00 | 0,00 | 0,31 | 9,09 | 0,0357 | 0,0005 | |||
| GWW / W.W. Grainger, Inc. | 0,00 | 0,00 | 0,31 | 5,41 | 0,0357 | -0,0007 | |||
| EEM / iShares, Inc. - iShares MSCI Emerging Markets ETF | 0,01 | 0,00 | 0,30 | 10,22 | 0,0346 | 0,0009 | |||
| CB / Chubb Limited | 0,00 | 0,00 | 0,30 | -4,19 | 0,0340 | -0,0041 | |||
| HON / Honeywell International Inc. | 0,00 | 0,00 | 0,29 | 10,23 | 0,0333 | 0,0008 | |||
| MMC / Marsh & McLennan Companies, Inc. | 0,00 | 4,62 | 0,28 | -6,42 | 0,0317 | -0,0047 | |||
| CMCSA / Comcast Corporation | 0,01 | 0,00 | 0,27 | -3,27 | 0,0305 | -0,0034 | |||
| KR / The Kroger Co. | 0,00 | 0,00 | 0,26 | 5,65 | 0,0301 | -0,0004 | |||
| COP / ConocoPhillips | 0,00 | 0,00 | 0,25 | -14,68 | 0,0287 | -0,0074 | |||
| YUMC / Yum China Holdings, Inc. | 0,01 | 0,00 | 0,24 | -14,23 | 0,0276 | -0,0070 | |||
| FNDX / Schwab Strategic Trust - Schwab Fundamental U.S. Large Company ETF | 0,01 | 0,00 | 0,24 | 3,91 | 0,0274 | -0,0009 | |||
| KMB / Kimberly-Clark Corporation | 0,00 | 0,00 | 0,23 | -9,49 | 0,0263 | -0,0049 | |||
| GEHC / GE HealthCare Technologies Inc. | 0,00 | -18,19 | 0,22 | -24,92 | 0,0255 | -0,0110 | |||
| AMAT / Applied Materials, Inc. | 0,00 | 0,22 | 0,0251 | 0,0251 | |||||
| AVGO / Broadcom Inc. | 0,00 | 0,22 | 0,0249 | 0,0249 | |||||
| EFA / iShares Trust - iShares MSCI EAFE ETF | 0,00 | 0,22 | 0,0247 | 0,0247 | |||||
| EMR / Emerson Electric Co. | 0,00 | 0,22 | 0,0246 | 0,0246 | |||||
| SO / The Southern Company | 0,00 | 0,00 | 0,21 | -0,47 | 0,0242 | -0,0019 | |||
| IWP / iShares Trust - iShares Russell Mid-Cap Growth ETF | 0,00 | 0,20 | 0,0234 | 0,0234 | |||||
| F / Ford Motor Company | 0,01 | 0,00 | 0,12 | 8,11 | 0,0138 | 0,0001 | |||
| DD / DuPont de Nemours, Inc. | 0,00 | -100,00 | 0,00 | 0,0000 | |||||
| UNH / UnitedHealth Group Incorporated | 0,00 | -100,00 | 0,00 | 0,0000 |