Statistik Dasar
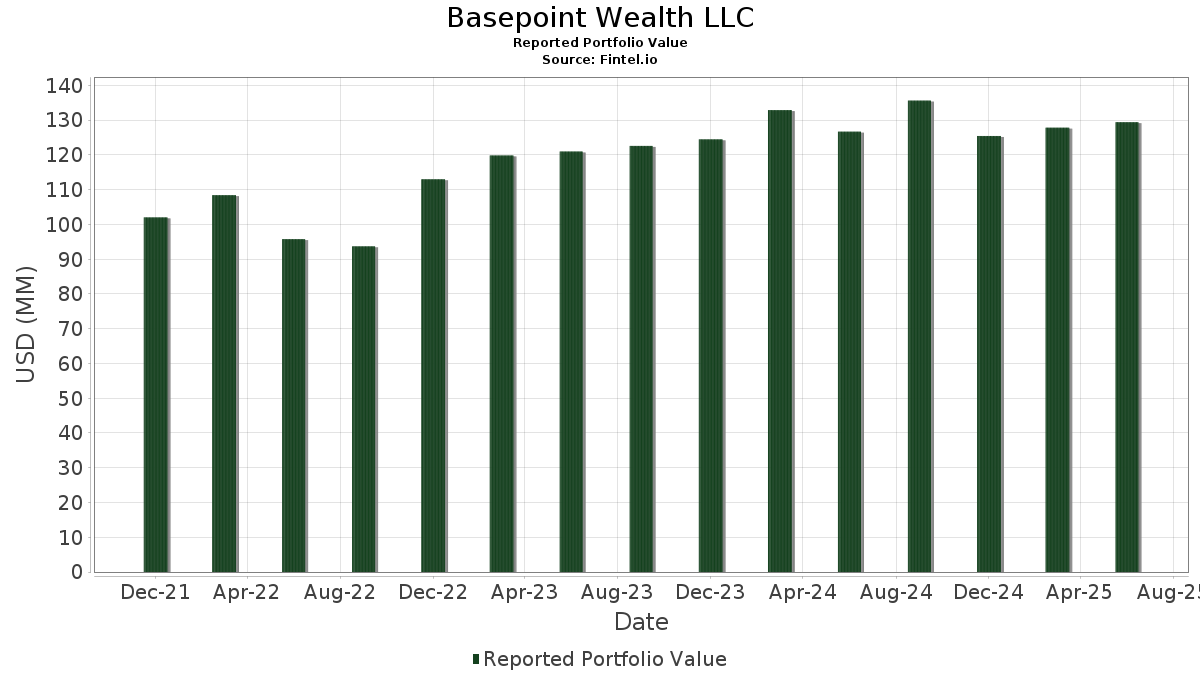
| Nilai Portofolio | $ 129.435.309 |
| Posisi Saat Ini | 104 |
Kepemilikan Terbaru, Kinerja, AUM (dari 13F, 13D)
Basepoint Wealth LLC telah diungkapkan 104 total kepemilikan dalam pengajuan SEC terbaru mereka. Nilai portofolio terbaru dihitung sebesar $ 129.435.309 USD. Aset yang dikelola (AUM) Aktual adalah nilai ini ditambah uang tunai (yang tidak diungkapkan). Kepemilikan teratas Basepoint Wealth LLC adalah Sprott Physical Gold Trust (US:PHYS) , Sprott Physical Silver Trust (US:PSLV) , Deere & Company (US:DE) , Berkshire Hathaway Inc. (US:BRK.B) , and Adams Natural Resources Fund, Inc. (US:PEO) . Posisi baru Basepoint Wealth LLC meliputi Lockheed Martin Corporation (US:LMT) , GE Vernova Inc. (US:GEV) , iShares Trust - iShares ESG MSCI KLD 400 ETF (US:DSI) , CSX Corporation (US:CSX) , and .
Peningkatan Teratas pada Kuartal Ini
Kami menggunakan perubahan alokasi portofolio karena ini adalah metrik yang paling berarti. Perubahan bisa disebabkan oleh perdagangan atau perubahan harga saham.
| Keamanan | Saham (MM) |
Nilai (MM$) |
Portofolio % | ΔPortofolio % |
|---|---|---|---|---|
| NVDA / NVIDIA Corporation | 0,02 | 2,41 | 1,8618 | 0,5850 |
| PSLV / Sprott Physical Silver Trust | 1,67 | 20,38 | 15,7456 | 0,4241 |
| MSFT / Microsoft Corporation | 0,00 | 1,86 | 1,4404 | 0,3837 |
| TPR / Tapestry, Inc. | 0,03 | 2,55 | 1,9712 | 0,2879 |
| DE / Deere & Company | 0,01 | 5,93 | 4,5853 | 0,2755 |
| LMT / Lockheed Martin Corporation | 0,00 | 0,29 | 0,2210 | 0,2210 |
| GEV / GE Vernova Inc. | 0,00 | 0,26 | 0,2030 | 0,2030 |
| GOOG / Alphabet Inc. | 0,00 | 0,86 | 0,6678 | 0,1962 |
| TSLA / Tesla, Inc. | 0,00 | 0,24 | 0,1829 | 0,1829 |
| SHOP / Shopify Inc. | 0,00 | 0,23 | 0,1782 | 0,1782 |
Penurunan Teratas pada Kuartal Ini
Kami menggunakan perubahan alokasi portofolio karena ini adalah metrik yang paling berarti. Perubahan bisa disebabkan oleh perdagangan atau perubahan harga saham.
| Keamanan | Saham (MM) |
Nilai (MM$) |
Portofolio % | ΔPortofolio % |
|---|---|---|---|---|
| BRK.B / Berkshire Hathaway Inc. | 0,01 | 5,09 | 3,9341 | -0,5662 |
| MMM / 3M Company | 0,01 | 1,94 | 1,5025 | -0,5028 |
| PEO / Adams Natural Resources Fund, Inc. | 0,18 | 3,75 | 2,8949 | -0,4712 |
| AAPL / Apple Inc. | 0,01 | 2,51 | 1,9358 | -0,2649 |
| PHYS / Sprott Physical Gold Trust | 1,10 | 27,85 | 21,5150 | -0,2560 |
| WSM / Williams-Sonoma, Inc. | 0,00 | 0,57 | 0,4368 | -0,2530 |
| DVA / DaVita Inc. | 0,00 | 0,00 | -0,2093 | |
| XPRO / Expro Group Holdings N.V. | 0,00 | 0,00 | -0,1934 | |
| BMY / Bristol-Myers Squibb Company | 0,00 | 0,00 | -0,1910 | |
| CPB / The Campbell's Company | 0,00 | 0,00 | -0,1849 |
13F dan Pengajuan Dana
Formulir ini diajukan pada tanggal 2025-10-16 untuk periode pelaporan 2025-06-30. Klik ikon tautan untuk melihat riwayat transaksi selengkapnya.
Tingkatkan untuk membuka data premium dan mengekspor ke Excel ![]() .
.
| Keamanan | Jenis | Rata-rata Harga Saham | Saham (MM) |
ΔSaham (%) |
ΔSaham (%) |
Nilai ($MM) |
Portofolio (%) |
ΔPortofolio (%) |
|
|---|---|---|---|---|---|---|---|---|---|
| PHYS / Sprott Physical Gold Trust | 1,10 | -5,04 | 27,85 | 0,05 | 21,5150 | -0,2560 | |||
| PSLV / Sprott Physical Silver Trust | 1,67 | -1,40 | 20,38 | 4,04 | 15,7456 | 0,4241 | |||
| DE / Deere & Company | 0,01 | -0,58 | 5,93 | 7,70 | 4,5853 | 0,2755 | |||
| BRK.B / Berkshire Hathaway Inc. | 0,01 | -2,97 | 5,09 | -11,49 | 3,9341 | -0,5662 | |||
| PEO / Adams Natural Resources Fund, Inc. | 0,18 | -7,07 | 3,75 | -12,92 | 2,8949 | -0,4712 | |||
| INGR / Ingredion Incorporated | 0,02 | -1,65 | 3,05 | -1,36 | 2,3564 | -0,0618 | |||
| TPR / Tapestry, Inc. | 0,03 | -4,94 | 2,55 | 18,54 | 1,9712 | 0,2879 | |||
| AAPL / Apple Inc. | 0,01 | -3,59 | 2,51 | -10,95 | 1,9358 | -0,2649 | |||
| NVDA / NVIDIA Corporation | 0,02 | 1,27 | 2,41 | 47,61 | 1,8618 | 0,5850 | |||
| GD / General Dynamics Corporation | 0,01 | -0,40 | 2,25 | 6,58 | 1,7407 | 0,0870 | |||
| MMM / 3M Company | 0,01 | -26,83 | 1,94 | -24,15 | 1,5025 | -0,5028 | |||
| MSFT / Microsoft Corporation | 0,00 | 4,14 | 1,86 | 38,07 | 1,4404 | 0,3837 | |||
| PEP / PepsiCo, Inc. | 0,01 | 0,58 | 1,59 | -11,47 | 1,2292 | -0,1758 | |||
| JLL / Jones Lang LaSalle Incorporated | 0,01 | -9,56 | 1,49 | -6,70 | 1,1517 | -0,0977 | |||
| SPHQ / Invesco Exchange-Traded Fund Trust - Invesco S&P 500 Quality ETF | 0,02 | 0,11 | 1,45 | 7,50 | 1,1192 | 0,0656 | |||
| ABBV / AbbVie Inc. | 0,01 | -0,26 | 1,37 | -11,61 | 1,0594 | -0,1544 | |||
| VZ / Verizon Communications Inc. | 0,03 | 2,91 | 1,28 | -1,84 | 0,9885 | -0,0310 | |||
| AMP / Ameriprise Financial, Inc. | 0,00 | 8,06 | 1,20 | 19,14 | 0,9236 | 0,1387 | |||
| IJH / iShares Trust - iShares Core S&P Mid-Cap ETF | 0,02 | 0,26 | 1,12 | 6,55 | 0,8680 | 0,0434 | |||
| RTX / RTX Corporation | 0,01 | -8,00 | 1,09 | 1,40 | 0,8419 | 0,0014 | |||
| LNT / Alliant Energy Corporation | 0,02 | 6,23 | 1,06 | -0,19 | 0,8177 | -0,0116 | |||
| ZM / Zoom Communications Inc. | 0,01 | -10,63 | 1,06 | -5,55 | 0,8154 | -0,0584 | |||
| SMG / The Scotts Miracle-Gro Company | 0,02 | -10,25 | 1,03 | 7,89 | 0,7920 | 0,0486 | |||
| PARA / Paramount Global | 0,07 | -23,11 | 0,95 | -17,04 | 0,7372 | -0,1627 | |||
| PG / The Procter & Gamble Company | 0,01 | 38,35 | 0,93 | 29,44 | 0,7203 | 0,1564 | |||
| AXP / American Express Company | 0,00 | -1,36 | 0,90 | 16,84 | 0,6976 | 0,0936 | |||
| NEE / NextEra Energy, Inc. | 0,01 | -0,21 | 0,87 | -2,24 | 0,6738 | -0,0242 | |||
| GOOG / Alphabet Inc. | 0,00 | 26,25 | 0,86 | 43,52 | 0,6678 | 0,1962 | |||
| META / Meta Platforms, Inc. | 0,00 | -2,67 | 0,83 | 24,66 | 0,6448 | 0,1208 | |||
| MCK / McKesson Corporation | 0,00 | 0,00 | 0,81 | 8,86 | 0,6270 | 0,0436 | |||
| GS / The Goldman Sachs Group, Inc. | 0,00 | -12,62 | 0,80 | 13,33 | 0,6173 | 0,0653 | |||
| CSCO / Cisco Systems, Inc. | 0,01 | 0,76 | 0,78 | 13,27 | 0,6009 | 0,0639 | |||
| JPM / JPMorgan Chase & Co. | 0,00 | -5,85 | 0,76 | 11,34 | 0,5843 | 0,0527 | |||
| PFG / Principal Financial Group, Inc. | 0,01 | -0,91 | 0,75 | -6,72 | 0,5799 | -0,0494 | |||
| BK / The Bank of New York Mellon Corporation | 0,01 | 5,03 | 0,74 | 14,11 | 0,5688 | 0,0641 | |||
| COP / ConocoPhillips | 0,01 | -6,19 | 0,71 | -19,82 | 0,5472 | -0,1439 | |||
| SCHF / Schwab Strategic Trust - Schwab International Equity ETF | 0,03 | 0,60 | 0,69 | 12,42 | 0,5321 | 0,0529 | |||
| WTBA / West Bancorporation, Inc. | 0,04 | 1,24 | 0,69 | -0,29 | 0,5313 | -0,0084 | |||
| FDL / First Trust Exchange-Traded Fund - First Trust Morningstar Dividend Leaders Index Fund | 0,02 | 2,78 | 0,68 | -1,02 | 0,5236 | -0,0115 | |||
| WFC / Wells Fargo & Company | 0,01 | -9,43 | 0,65 | 1,09 | 0,5024 | -0,0008 | |||
| NTR / Nutrien Ltd. | 0,01 | -17,80 | 0,64 | -3,63 | 0,4923 | -0,0250 | |||
| PSX / Phillips 66 | 0,01 | -2,04 | 0,64 | -5,37 | 0,4911 | -0,0341 | |||
| XOM / Exxon Mobil Corporation | 0,01 | -0,96 | 0,63 | -10,20 | 0,4902 | -0,0626 | |||
| HD / The Home Depot, Inc. | 0,00 | 1,24 | 0,60 | 1,18 | 0,4625 | 0,0000 | |||
| EMN / Eastman Chemical Company | 0,01 | -8,09 | 0,60 | -22,19 | 0,4612 | -0,1383 | |||
| IPG / The Interpublic Group of Companies, Inc. | 0,02 | -7,12 | 0,58 | -16,21 | 0,4513 | -0,0944 | |||
| AMZN / Amazon.com, Inc. | 0,00 | 29,39 | 0,58 | 49,22 | 0,4454 | 0,1432 | |||
| WSM / Williams-Sonoma, Inc. | 0,00 | -37,96 | 0,57 | -35,87 | 0,4368 | -0,2530 | |||
| QCOM / QUALCOMM Incorporated | 0,00 | 15,49 | 0,54 | 19,64 | 0,4147 | 0,0641 | |||
| ABT / Abbott Laboratories | 0,00 | 3,50 | 0,54 | 6,15 | 0,4135 | 0,0191 | |||
| CAT / Caterpillar Inc. | 0,00 | -0,07 | 0,53 | 17,63 | 0,4075 | 0,0567 | |||
| GE / General Electric Company | 0,00 | 2,00 | 0,53 | 31,25 | 0,4057 | 0,0927 | |||
| HBI / Hanesbrands Inc. | 0,11 | -3,11 | 0,51 | -23,20 | 0,3970 | -0,1256 | |||
| SCHD / Schwab Strategic Trust - Schwab U.S. Dividend Equity ETF | 0,02 | -1,28 | 0,51 | -6,46 | 0,3918 | -0,0322 | |||
| WMT / Walmart Inc. | 0,00 | 0,14 | 0,49 | 11,42 | 0,3776 | 0,0348 | |||
| ATI / ATI Inc. | 0,01 | -0,90 | 0,48 | 64,63 | 0,3744 | 0,1439 | |||
| SWKS / Skyworks Solutions, Inc. | 0,01 | -11,71 | 0,45 | 1,80 | 0,3503 | 0,0019 | |||
| INTC / Intel Corporation | 0,02 | -8,53 | 0,45 | -9,84 | 0,3475 | -0,0424 | |||
| SCHX / Schwab Strategic Trust - Schwab U.S. Large-Cap ETF | 0,02 | 0,29 | 0,45 | 11,14 | 0,3472 | 0,0306 | |||
| CARR / Carrier Global Corporation | 0,01 | 2,27 | 0,45 | 18,04 | 0,3445 | 0,0491 | |||
| SCHV / Schwab Strategic Trust - Schwab U.S. Large-Cap Value ETF | 0,02 | -3,60 | 0,43 | 0,23 | 0,3352 | -0,0029 | |||
| ISCG / iShares Trust - iShares Morningstar Small-Cap Growth ETF | 0,01 | 0,08 | 0,42 | 10,67 | 0,3207 | 0,0270 | |||
| SCHG / Schwab Strategic Trust - Schwab U.S. Large-Cap Growth ETF | 0,01 | -6,35 | 0,40 | 9,26 | 0,3104 | 0,0227 | |||
| NFLX / Netflix, Inc. | 0,00 | -40,58 | 0,38 | -14,67 | 0,2969 | -0,0554 | |||
| CVS / CVS Health Corporation | 0,01 | -2,86 | 0,38 | -1,30 | 0,2935 | -0,0069 | |||
| PM / Philip Morris International Inc. | 0,00 | 0,00 | 0,37 | 14,77 | 0,2888 | 0,0341 | |||
| KR / The Kroger Co. | 0,01 | -3,46 | 0,37 | 2,52 | 0,2828 | 0,0029 | |||
| CVX / Chevron Corporation | 0,00 | 3,16 | 0,36 | -11,79 | 0,2780 | -0,0407 | |||
| VXUS / Vanguard STAR Funds - Vanguard Total International Stock ETF | 0,01 | 0,72 | 0,36 | 12,19 | 0,2776 | 0,0268 | |||
| ELV / Elevance Health, Inc. | 0,00 | -1,42 | 0,35 | -11,84 | 0,2710 | -0,0403 | |||
| CMI / Cummins Inc. | 0,00 | -32,85 | 0,35 | -29,92 | 0,2704 | -0,1198 | |||
| WPC / W. P. Carey Inc. | 0,01 | 1,54 | 0,35 | 0,29 | 0,2677 | -0,0023 | |||
| IVW / iShares Trust - iShares S&P 500 Growth ETF | 0,00 | 0,10 | 0,35 | 18,90 | 0,2673 | 0,0393 | |||
| MELI / MercadoLibre, Inc. | 0,00 | 0,00 | 0,32 | 34,44 | 0,2504 | 0,0612 | |||
| AGG / iShares Trust - iShares Core U.S. Aggregate Bond ETF | 0,00 | 1,05 | 0,31 | 1,32 | 0,2369 | 0,0002 | |||
| VEU / Vanguard International Equity Index Funds - Vanguard FTSE All-World ex-US ETF | 0,00 | 0,45 | 0,30 | 11,40 | 0,2341 | 0,0212 | |||
| IVV / iShares Trust - iShares Core S&P 500 ETF | 0,00 | 0,00 | 0,30 | 10,70 | 0,2324 | 0,0197 | |||
| LMT / Lockheed Martin Corporation | 0,00 | 0,29 | 0,2210 | 0,2210 | |||||
| FDX / FedEx Corporation | 0,00 | -0,32 | 0,28 | -7,19 | 0,2200 | -0,0197 | |||
| HYD / VanEck ETF Trust - VanEck High Yield Muni ETF | 0,01 | 0,37 | 0,28 | -1,39 | 0,2196 | -0,0062 | |||
| AMAT / Applied Materials, Inc. | 0,00 | 0,26 | 0,28 | 26,94 | 0,2149 | 0,0429 | |||
| GEV / GE Vernova Inc. | 0,00 | 0,26 | 0,2030 | 0,2030 | |||||
| GOOGL / Alphabet Inc. | 0,00 | 4,11 | 0,24 | 18,72 | 0,1863 | 0,0273 | |||
| ALB / Albemarle Corporation | 0,00 | -3,05 | 0,24 | -15,71 | 0,1830 | -0,0366 | |||
| TSLA / Tesla, Inc. | 0,00 | 0,24 | 0,1829 | 0,1829 | |||||
| SHOP / Shopify Inc. | 0,00 | 0,23 | 0,1782 | 0,1782 | |||||
| SPLV / Invesco Exchange-Traded Fund Trust II - Invesco S&P 500 Low Volatility ETF | 0,00 | 0,35 | 0,23 | -2,13 | 0,1779 | -0,0062 | |||
| STEW / SRH Total Return Fund, Inc. | 0,01 | 0,90 | 0,23 | 3,62 | 0,1771 | 0,0037 | |||
| KO / The Coca-Cola Company | 0,00 | 11,60 | 0,23 | 10,19 | 0,1757 | 0,0144 | |||
| K / Kellanova | 0,00 | -1,08 | 0,23 | -4,64 | 0,1751 | -0,0108 | |||
| DIA / SPDR Dow Jones Industrial Average ETF Trust | 0,00 | 0,00 | 0,22 | 5,16 | 0,1731 | 0,0062 | |||
| MDYG / SPDR Series Trust - SPDR S&P 400 Mid Cap Growth ETF | 0,00 | 0,23 | 0,22 | 9,31 | 0,1727 | 0,0131 | |||
| CI / The Cigna Group | 0,00 | -20,90 | 0,22 | -20,50 | 0,1711 | -0,0469 | |||
| SBI / Western Asset Intermediate Muni Fund Inc. | 0,03 | -0,04 | 0,22 | -3,93 | 0,1707 | -0,0086 | |||
| PFE / Pfizer Inc. | 0,01 | 0,22 | 0,1675 | 0,1675 | |||||
| SEE / Sealed Air Corporation | 0,01 | -15,26 | 0,22 | -8,86 | 0,1673 | -0,0188 | |||
| DTF / DTF Tax-Free Income 2028 Term Fund Inc. | 0,02 | 0,87 | 0,22 | 0,93 | 0,1669 | -0,0009 | |||
| DSI / iShares Trust - iShares ESG MSCI KLD 400 ETF | 0,00 | 0,20 | 0,1581 | 0,1581 | |||||
| CSX / CSX Corporation | 0,01 | 0,20 | 0,1567 | 0,1567 | |||||
| PFO / Flaherty & Crumrine Preferred Income Opportunity Fund Inc. | 0,02 | 1,43 | 0,19 | 1,62 | 0,1455 | 0,0007 | |||
| KTF / DWS Municipal Income Trust | 0,02 | 0,00 | 0,18 | -5,64 | 0,1423 | -0,0106 | |||
| DNP / DNP Select Income Fund Inc. | 0,01 | 2,13 | 0,13 | 0,80 | 0,0980 | -0,0001 | |||
| VFL / abrdn National Municipal Income Fund | 0,01 | 1,55 | 0,11 | -2,65 | 0,0851 | -0,0040 | |||
| OXFORD LANE CAP CORP COM / CEF (691543102) | 0,01 | 0,06 | 0,0000 | ||||||
| V / Visa Inc. | 0,00 | -100,00 | 0,00 | -100,00 | -0,1578 | ||||
| UNH / UnitedHealth Group Incorporated | 0,00 | -100,00 | 0,00 | -100,00 | -0,1705 | ||||
| SLB / SLB N.V. | 0,00 | -100,00 | 0,00 | -100,00 | -0,1598 | ||||
| DVA / DaVita Inc. | 0,00 | -100,00 | 0,00 | -100,00 | -0,2093 | ||||
| XPRO / Expro Group Holdings N.V. | 0,00 | -100,00 | 0,00 | -100,00 | -0,1934 | ||||
| CPB / The Campbell's Company | 0,00 | -100,00 | 0,00 | -100,00 | -0,1849 | ||||
| BMY / Bristol-Myers Squibb Company | 0,00 | -100,00 | 0,00 | -100,00 | -0,1910 |