Statistik Dasar
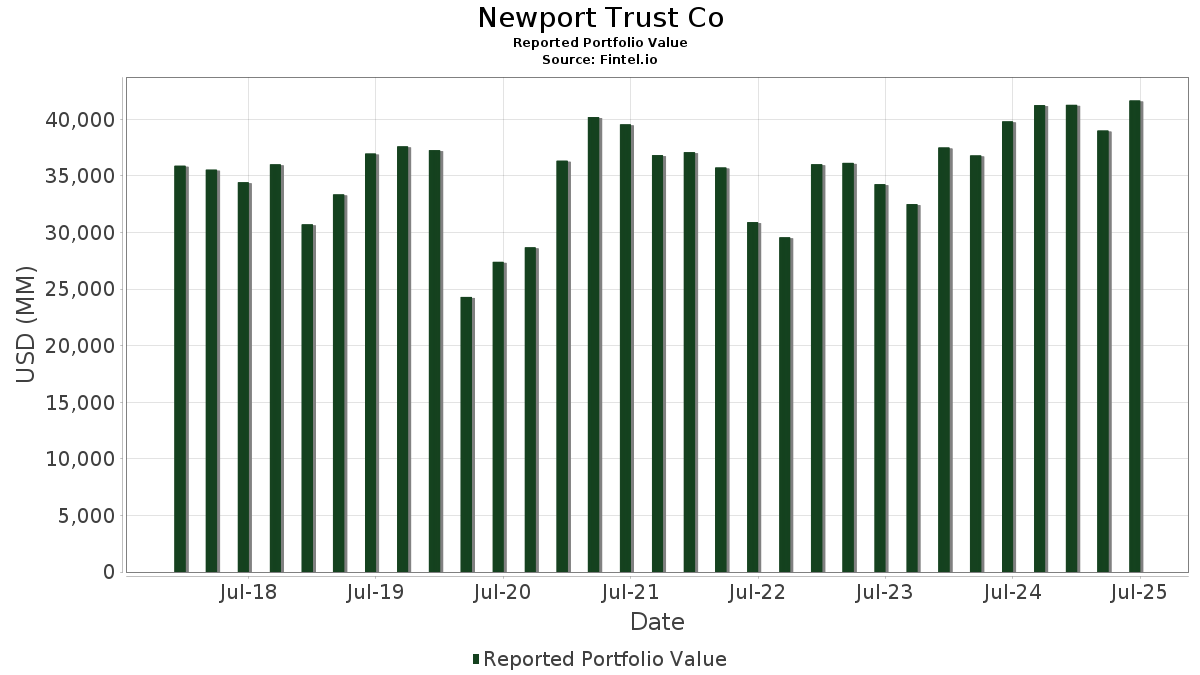
| Nilai Portofolio | $ 41.653.776.355 |
| Posisi Saat Ini | 64 |
Kepemilikan Terbaru, Kinerja, AUM (dari 13F, 13D)
Newport Trust Co telah diungkapkan 64 total kepemilikan dalam pengajuan SEC terbaru mereka. Nilai portofolio terbaru dihitung sebesar $ 41.653.776.355 USD. Aset yang dikelola (AUM) Aktual adalah nilai ini ditambah uang tunai (yang tidak diungkapkan). Kepemilikan teratas Newport Trust Co adalah The Boeing Company (US:BA) , AT&T Inc. (US:T) , General Dynamics Corporation (US:GD) , Parsons Corporation (US:PSN) , and Honeywell International Inc. (US:HON) . Posisi baru Newport Trust Co meliputi LATAM Airlines Group S.A. - Depositary Receipt (Common Stock) (US:LTM) , DuPont de Nemours, Inc. (US:DD) , . Industri teratas di Newport Trust Co adalah "Transportation Equipment" (sic 37) , and "General Merchandise Stores" (sic 53) .
Peningkatan Teratas pada Kuartal Ini
Kami menggunakan perubahan alokasi portofolio karena ini adalah metrik yang paling berarti. Perubahan bisa disebabkan oleh perdagangan atau perubahan harga saham.
| Keamanan | Saham (MM) |
Nilai (MM$) |
Portofolio % | ΔPortofolio % |
|---|---|---|---|---|
| 28,49 | 5.969,71 | 14,3317 | 0,9755 | |
| 52,13 | 3.741,24 | 8,9818 | 0,9386 | |
| 5,63 | 229,01 | 0,5498 | 0,5498 | |
| 11,26 | 1.395,88 | 3,3511 | 0,4359 | |
| 4,67 | 1.951,74 | 4,6856 | 0,3038 | |
| 2,12 | 520,51 | 1,2496 | 0,2233 | |
| 4,47 | 471,85 | 1,1328 | 0,1918 | |
| 4,76 | 634,41 | 1,5231 | 0,1522 | |
| 2,56 | 545,30 | 1,3091 | 0,1286 | |
| 0,57 | 38,93 | 0,0935 | 0,0935 |
Penurunan Teratas pada Kuartal Ini
Kami menggunakan perubahan alokasi portofolio karena ini adalah metrik yang paling berarti. Perubahan bisa disebabkan oleh perdagangan atau perubahan harga saham.
| Keamanan | Saham (MM) |
Nilai (MM$) |
Portofolio % | ΔPortofolio % |
|---|---|---|---|---|
| 10,08 | 2.594,86 | 6,2296 | -0,8903 | |
| 187,09 | 5.414,42 | 12,9986 | -0,7623 | |
| 1,71 | 906,27 | 2,1757 | -0,6148 | |
| 6,16 | 937,10 | 2,2497 | -0,3104 | |
| 0,13 | 9,63 | 0,0231 | -0,2701 | |
| 14,42 | 4.205,01 | 10,0952 | -0,2222 | |
| 1,05 | 406,87 | 0,9768 | -0,2134 | |
| 5,47 | 454,31 | 1,0907 | -0,1170 | |
| 12,83 | 972,01 | 2,3335 | -0,1058 | |
| 1,09 | 266,86 | 0,6407 | -0,1018 |
Pengajuan 13D/G
Ini adalah daftar pengajuan 13D dan 13G yang dilakukan setahun terakhir (jika ada). Klik ikon tautan untuk melihat riwayat transaksi selengkapnya. Baris hijau menunjukkan posisi baru. Baris merah menunjukkan posisi yang sudah ditutup.
| Tanggal Berkas | Formulir | Keamanan | Sebelumnya Saham |
Saat ini Saham |
ΔBagikan % | % Kepemilikan |
% ΔKepemilikan | |
|---|---|---|---|---|---|---|---|---|
| 2025-08-07 | PSN / Parsons Corporation | 53.506.167 | 52.128.190 | -2,58 | 48,77 | -3,21 | ||
| 2025-02-06 | BA / The Boeing Company | 32.395.589 | 30.700.732 | -5,23 | 4,10 | -23,36 |
13F dan Pengajuan Dana
Formulir ini diajukan pada tanggal 2025-08-14 untuk periode pelaporan 2025-06-30. Klik ikon tautan untuk melihat riwayat transaksi selengkapnya.
Tingkatkan untuk membuka data premium dan mengekspor ke Excel ![]() .
.
| Keamanan | Jenis | Rata-rata Harga Saham | Saham (MM) |
ΔSaham (%) |
ΔSaham (%) |
Nilai ($MM) |
Portofolio (%) |
ΔPortofolio (%) |
|
|---|---|---|---|---|---|---|---|---|---|
| BA / The Boeing Company | 28,49 | -6,71 | 5.969,71 | 14,61 | 14,3317 | 0,9755 | |||
| T / AT&T Inc. | 187,09 | -1,41 | 5.414,42 | 0,89 | 12,9986 | -0,7623 | |||
| GD / General Dynamics Corporation | 14,42 | -2,33 | 4.205,01 | 4,51 | 10,0952 | -0,2222 | |||
| PSN / Parsons Corporation | 52,13 | -1,60 | 3.741,24 | 19,27 | 8,9818 | 0,9386 | |||
| HON / Honeywell International Inc. | 14,26 | -3,18 | 3.320,05 | 6,49 | 7,9706 | -0,0242 | |||
| GE / General Electric Company | 10,08 | -27,33 | 2.594,86 | -6,55 | 6,2296 | -0,8903 | |||
| DDS / Dillard's, Inc. | 4,67 | -2,10 | 1.951,74 | 14,22 | 4,6856 | 0,3038 | |||
| F / Ford Motor Company | 148,45 | -1,26 | 1.610,66 | 6,81 | 3,8668 | -0,0001 | |||
| DIS / The Walt Disney Company | 11,26 | -2,28 | 1.395,88 | 22,78 | 3,3511 | 0,4359 | |||
| SRE / Sempra | 12,83 | -3,77 | 972,01 | 2,18 | 2,3335 | -0,1058 | |||
| MMM / 3M Company | 6,16 | -9,46 | 937,10 | -6,14 | 2,2497 | -0,3104 | |||
| GEV / GE Vernova Inc. | 1,71 | -51,95 | 906,27 | -16,72 | 2,1757 | -0,6148 | |||
| EMR / Emerson Electric Co. | 4,76 | -2,42 | 634,41 | 18,67 | 1,5231 | 0,1522 | |||
| SPGI / S&P Global Inc. | 1,08 | -0,94 | 571,75 | 2,80 | 1,3726 | -0,0535 | |||
| COF / Capital One Financial Corporation | 2,56 | -0,18 | 545,30 | 18,44 | 1,3091 | 0,1286 | |||
| WWD / Woodward, Inc. | 2,12 | -3,17 | 520,51 | 30,05 | 1,2496 | 0,2233 | |||
| JCI / Johnson Controls International plc | 4,47 | -4,03 | 471,85 | 28,58 | 1,1328 | 0,1918 | |||
| ETR / Entergy Corporation | 5,47 | -0,78 | 454,31 | -3,53 | 1,0907 | -0,1170 | |||
| DAL / Delta Air Lines, Inc. | 9,22 | 0,00 | 453,26 | 12,80 | 1,0882 | 0,0578 | |||
| NKE / NIKE, Inc. | 5,76 | -1,56 | 409,11 | 10,17 | 0,9822 | 0,0299 | |||
| ELV / Elevance Health, Inc. | 1,05 | -1,97 | 406,87 | -12,34 | 0,9768 | -0,2134 | |||
| DRI / Darden Restaurants, Inc. | 1,86 | -2,02 | 406,35 | 2,79 | 0,9755 | -0,0381 | |||
| HIG / The Hartford Insurance Group, Inc. | 2,57 | -2,12 | 326,20 | 0,36 | 0,7831 | -0,0503 | |||
| UAL / United Airlines Holdings, Inc. | 3,42 | -1,17 | 271,95 | 13,98 | 0,6529 | 0,0411 | |||
| HUM / Humana Inc. | 1,09 | -0,25 | 266,86 | -7,84 | 0,6407 | -0,1018 | |||
| XEL / Xcel Energy Inc. | 3,91 | -2,88 | 266,38 | -6,57 | 0,6395 | -0,0916 | |||
| NI / NiSource Inc. | 5,94 | -0,93 | 239,47 | -0,31 | 0,5749 | -0,0411 | |||
| LTM / LATAM Airlines Group S.A. - Depositary Receipt (Common Stock) | 5,63 | 229,01 | 0,5498 | 0,5498 | |||||
| WHR / Whirlpool Corporation | 2,06 | 13,90 | 208,63 | 28,17 | 0,5009 | 0,0835 | |||
| HWM / Howmet Aerospace Inc. | 1,07 | -9,29 | 199,49 | 30,15 | 0,4789 | 0,0859 | |||
| HBAN / Huntington Bancshares Incorporated | 10,67 | -0,79 | 178,89 | 10,78 | 0,4295 | 0,0154 | |||
| STT / State Street Corporation | 1,57 | -1,74 | 167,11 | 16,71 | 0,4012 | 0,0340 | |||
| BMO / Bank of Montreal | 1,35 | -0,63 | 148,90 | 15,10 | 0,3575 | 0,0257 | |||
| MCO / Moody's Corporation | 0,29 | -0,99 | 147,09 | 6,64 | 0,3531 | -0,0006 | |||
| BTI / British American Tobacco p.l.c. - Depositary Receipt (Common Stock) | 2,74 | -1,26 | 129,66 | 12,96 | 0,3113 | 0,0169 | |||
| WBD / Warner Bros. Discovery, Inc. | 8,59 | -4,34 | 98,45 | 2,16 | 0,2364 | -0,0107 | |||
| PM / Philip Morris International Inc. | 0,49 | -0,75 | 90,09 | 13,88 | 0,2163 | 0,0134 | |||
| M / Macy's, Inc. | 7,34 | 0,34 | 85,55 | -6,85 | 0,2054 | -0,0301 | |||
| BBY / Best Buy Co., Inc. | 1,16 | 2,79 | 77,71 | -6,26 | 0,1866 | -0,0260 | |||
| KHC / The Kraft Heinz Company | 2,56 | -5,50 | 66,00 | -19,82 | 0,1585 | -0,0526 | |||
| WAT / Waters Corporation | 0,18 | -0,26 | 63,63 | -5,54 | 0,1528 | -0,0200 | |||
| VVV / Valvoline Inc. | 1,51 | -3,64 | 57,30 | 4,83 | 0,1376 | -0,0026 | |||
| ED / Consolidated Edison, Inc. | 0,51 | -1,69 | 51,50 | -10,79 | 0,1236 | -0,0244 | |||
| PNW / Pinnacle West Capital Corporation | 0,50 | -2,90 | 44,80 | -8,80 | 0,1075 | -0,0184 | |||
| DD / DuPont de Nemours, Inc. | 0,57 | 38,93 | 0,0935 | 0,0935 | |||||
| BDC / Belden Inc. | 0,33 | 4,16 | 38,03 | 20,31 | 0,0913 | 0,0102 | |||
| GT / The Goodyear Tire & Rubber Company | 3,56 | -6,49 | 36,94 | 4,94 | 0,0887 | -0,0016 | |||
| WBA / Walgreens Boots Alliance, Inc. | 2,81 | -1,99 | 32,31 | 0,73 | 0,0776 | -0,0047 | |||
| OZK / Bank OZK | 0,68 | 3,76 | 32,08 | 12,38 | 0,0770 | 0,0038 | |||
| ASH / Ashland Inc. | 0,54 | 1,61 | 26,91 | -13,83 | 0,0646 | -0,0155 | |||
| BOH / Bank of Hawaii Corporation | 0,36 | -1,28 | 24,62 | -3,34 | 0,0591 | -0,0062 | |||
| RAMP / LiveRamp Holdings, Inc. | 0,63 | -2,26 | 20,66 | 22,27 | 0,0496 | 0,0063 | |||
| MOS / The Mosaic Company | 0,56 | -7,72 | 20,58 | 24,64 | 0,0494 | 0,0071 | |||
| TRMK / Trustmark Corporation | 0,46 | -4,27 | 16,82 | 1,20 | 0,0404 | -0,0022 | |||
| SFNC / Simmons First National Corporation | 0,59 | -3,16 | 11,27 | -10,57 | 0,0271 | -0,0053 | |||
| BBWI / Bath & Body Works, Inc. | 0,30 | -0,83 | 9,65 | 5,15 | 0,0232 | -0,0004 | |||
| SOLV / Solventum Corporation | 0,13 | -91,56 | 9,63 | -91,58 | 0,0231 | -0,2701 | |||
| GNW / Genworth Financial, Inc. | 1,05 | -7,41 | 8,14 | 1,61 | 0,0195 | -0,0010 | |||
| MO / Altria Group, Inc. | 0,13 | -1,80 | 7,54 | -4,07 | 0,0181 | -0,0021 | |||
| UIS / Unisys Corporation | 1,22 | -2,96 | 5,51 | -4,22 | 0,0132 | -0,0015 | |||
| MDLZ / Mondelez International, Inc. | 0,05 | -3,25 | 3,70 | -3,82 | 0,0089 | -0,0010 | |||
| VSCO / Victoria's Secret & Co. | 0,10 | -2,35 | 1,98 | 2,70 | 0,0048 | -0,0002 | |||
| MCB / Metropolitan Bank Holding Corp. | 0,01 | 3,31 | 0,70 | 29,28 | 0,0017 | 0,0003 | |||
| FTS / Fortis Inc. | 0,01 | 2,77 | 0,45 | 7,62 | 0,0011 | 0,0000 | |||
| DHR / Danaher Corporation | 0,00 | -100,00 | 0,00 | 0,0000 | |||||
| PINC / Premier, Inc. | 0,00 | -100,00 | 0,00 | 0,0000 |