JAKKS Pacific, Inc.
Perkenalan
Halaman ini memberikan analisis komprehensif tentang riwayat insider trading yang diketahui di Axar Capital Management L.p.. Insider adalah pejabat, direktur, atau investor penting dalam suatu perusahaan. Adalah ilegal bagi insider untuk melakukan perdagangan di perusahaan mereka berdasarkan informasi spesifik dan non-publik. Hal ini tidak berarti bahwa mereka dilarang melakukan perdagangan apa pun di perusahaan mereka sendiri. Namun, mereka harus melaporkan semua perdagangan ke SEC melalui Formulir 4. Meskipun ada pembatasan ini, penelitian akademis menunjukkan bahwa insider – secara umum – cenderung mengungguli pasar di perusahaan mereka sendiri.
Profitabilitas Perdagangan Rata-rata
Profitabilitas perdagangan rata-rata adalah pengembalian rata-rata dari seluruh pembelian pasar terbuka yang dilakukan oleh insider dalam 3 tahun terakhir. Untuk menghitungnya, kami memeriksa setiap pembelian pasar terbuka dan tidak terencana yang dilakukan oleh insider, tidak termasuk semua perdagangan yang ditandai sebagai bagian dari rencana perdagangan 10b5-1. Kami kemudian menghitung kinerja rata-rata perdagangan tersebut selama 3, 6, dan 12 bulan, merata-ratakan setiap durasi tersebut untuk menghasilkan metrik kinerja akhir untuk setiap perdagangan. Terakhir, kami menghitung rata-rata semua metrik kinerja untuk menghitung metrik kinerja bagi insider. Daftar ini hanya mencakup insider yang telah melakukan setidaknya tiga perdagangan dalam 2 tahun terakhir.
Jika profitabilitas perdagangan insider ini adalah "T/A", maka insider tersebut belum melakukan pembelian di pasar terbuka dalam 3 tahun terakhir, atau perdagangan yang mereka lakukan terlalu baru untuk menghitung metrik kinerja yang dapat diandalkan.
Frekuensi Pembaruan: Harian
Perusahaan dengan Posisi Insider yang Dilaporkan
Pengajuan SEC menunjukkan Axar Capital Management L.p. telah melaporkan kepemilikan atau perdagangan di perusahaan berikut:
| Keamanan | Judul | Kepemilikan Terbaru yang Dilaporkan |
|---|---|---|
| US:STON / StoneMor Inc | Director, 10% Owner | 0 |
| US:SSI / Stage Stores, Inc. | 10% Owner | 8.600.000 |
| US:US86184VAD01 / StoneMor Partners LP / Cornerstone Family Services of West Virginia Subsidiary | Director, 10% Owner | 0 |
| US:JAKK / JAKKS Pacific, Inc. | Director | 2.321.467 |
| US:AXAR / Axar Acquisition Corp. | 10% Owner | 5.240.000 |
| US:RJETQ / Republic Airways Holdings, Inc. | 10% Owner | 20.230.000 |
Bagaimana Menafsirkan Grafik
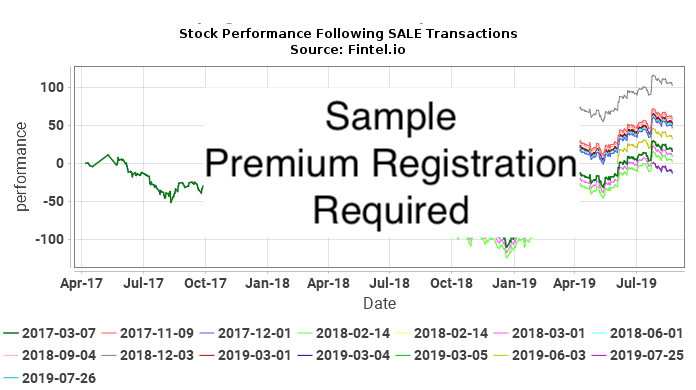
Bagan berikut menunjukkan kinerja saham sekuritas setelah setiap perdagangan pasar terbuka dan tidak terencana yang dilakukan oleh Axar Capital Management L.p.. Perdagangan yang tidak direncanakan adalah perdagangan yang tidak dilakukan sebagai bagian dari rencana perdagangan 10b5-1. Kinerja saham dipetakan sebagai persentase perubahan kumulatif harga saham. Misalnya, jika perdagangan insider dilakukan pada tanggal 1 Januari 2019, grafik akan menunjukkan persentase perubahan harian sekuritas hingga hari ini. Jika harga saham naik dari $10 menjadi $15 selama waktu ini, persentase perubahan harga saham kumulatif akan menjadi 50%. Perubahan harga dari $10 menjadi $20 adalah 100%, dan perubahan harga dari $10 menjadi $5 adalah -50%.
Pada akhirnya, kami mencoba untuk menentukan seberapa dekat korelasi perdagangan insider dengan keuntungan berlebih (positif atau negatif) pada harga saham untuk melihat apakah insider mengatur waktu perdagangannya untuk mendapatkan keuntungan dari informasi insider. Pertimbangkan situasi di mana insider melakukan hal ini. Dalam situasi ini, kita mengharapkan (a) keuntungan positif setelah pembelian, atau (b) keuntungan negatif setelah penjualan. Dalam kasus (a), grafik PEMBELIAN akan menunjukkan serangkaian kurva yang miring ke atas, yang menunjukkan keuntungan positif setelah setiap transaksi pembelian. Dalam kasus (b), grafik PENJUALAN akan menunjukkan serangkaian kurva yang miring ke bawah, yang menunjukkan keuntungan negatif setelah setiap transaksi penjualan.
Namun, hal ini saja tidak cukup untuk menarik kesimpulan. Jika, misalnya, harga saham perusahaan berada dalam kenaikan non-siklus selama bertahun-tahun, maka kita perkirakan semua lahan pasca pembelian akan miring ke atas. Demikian pula, penurunan non-siklus selama bertahun-tahun akan mengakibatkan penurunan pasca-perdagangan. Tak satu pun dari grafik ini menunjukkan aktivitas insider trading.
Indikator terkuat adalah situasi di mana harga saham sangat bersiklus, dan terdapat sinyal positif pada grafik PEMBELIAN dan plot negatif pada grafik PENJUALAN. Situasi ini akan sangat memberi isyarat kepada insider yang mengatur waktu perdagangan demi keuntungan finansial mereka.
Pembelian Insider JAKK / JAKKS Pacific, Inc. - Analisis Keuntungan Jangka Pendek
Di bagian ini, kami menganalisis profitabilitas setiap pembelian insider di pasar terbuka yang tidak direncanakan dan dilakukan pada JAKK / JAKKS Pacific, Inc.. Analisis ini membantu untuk memahami apakah insider secara konsisten menghasilkan keuntungan yang tidak normal, dan layak untuk diikuti. Analisis ini dilakukan selama satu tahun setelah setiap perdagangan dan hasilnya bersifat teoretis .
Tabel berikut ini menunjukkan pembelian pasar terbuka terkini yang bukan merupakan bagian dari rencana perdagangan otomatis.
| Tanggal Perdagangan | Kode | Insider | Dilaporkan Saham |
Dilaporkan Harga |
Disesuaikan Saham |
Disesuaikan Harga |
Dasar Biaya | Hari ke Maksimal |
Harga di Maksimal |
Maksimal Keuntungan ($) |
Pengembalian Maksimal (%) |
|---|---|---|---|---|---|---|---|
| Tidak ada perdagangan pasar terbuka yang tidak direncanakan untuk kombinasi insider dan keamanan ini |
Harga yang Disesuaikan adalah harga yang disesuaikan secara terpisah. Saham yang Disesuaikan adalah saham yang disesuaikan dengan pembagiannya.
Penjualan Insider JAKK / JAKKS Pacific, Inc. - Analisis Kerugian Jangka Pendek
Di bagian ini, kami menganalisis penghindaran kerugian jangka pendek dari setiap penjualan insider di pasar terbuka yang tidak direncanakan dan dilakukan di JAKK / JAKKS Pacific, Inc.. Pola penghindaran kerugian yang konsisten mungkin menunjukkan bahwa transaksi penjualan pada masa depan dapat memprediksi penurunan harga. Analisis ini dilakukan selama satu tahun setelah setiap perdagangan dan hasilnya bersifat teoretis .
Tabel berikut ini menunjukkan penjualan pasar terbuka terkini yang bukan merupakan bagian dari rencana perdagangan otomatis.
| Tanggal Perdagangan | Kode | Insider | Dilaporkan Saham |
Dilaporkan Harga |
Disesuaikan Saham |
Disesuaikan Harga |
Dasar Biaya | Hari ke Minimal |
Harga di Minimal |
Kerugian Maksimal Dihindari ($) |
Kerugian Maksimal Dihindari (%) |
|---|---|---|---|---|---|---|---|
| Tidak ada perdagangan pasar terbuka yang tidak direncanakan untuk kombinasi insider dan keamanan ini |
Harga yang Disesuaikan adalah harga yang disesuaikan secara terpisah. Saham yang Disesuaikan adalah saham yang disesuaikan dengan pembagiannya.
Riwayat Insider Trading
Tabel ini menunjukkan daftar lengkap perdagangan insider yang dilakukan oleh Axar Capital Management L.p. sebagaimana diungkapkan kepada Securities Exchange Commission (SEC).
| Tanggal Berkas | Tanggal Trans | Formulir | Kode | Keamanan | Kode | Saham | Sisa Saham | Persen Mengubah |
Saham Harga |
Trans Nilai |
Tersisa Nilai |
|
|---|---|---|---|---|---|---|---|---|---|---|---|---|
| 2022-11-07 |
|
4 | STON |
Stonemor Inc.
Common Stock, par value $0.01 (Common Stock) |
A - Award | -88.633.045 | 0 | -100,00 | 3,50 | -310.215.658 | ||
| 2021-04-15 |
|
4 | STON |
Stonemor Inc.
Common Stock, par value $0.01 per share |
P - Purchase | 5.522.732 | 88.633.045 | 6,65 | 2,20 | 12.150.010 | 194.992.699 | |
| 2020-11-23 |
|
4 | STON |
Stonemor Inc.
Common Stock, par value $0.01 per share |
A - Award | 10.305.369 | 83.110.313 | 14,15 | 1,03 | 10.614.530 | 85.603.622 | |
| 2020-06-23 |
|
4 | STON |
Stonemor Inc.
Series A Preferred Stock, $0.01 par value per share |
D - Sale to Issuer | -176 | 0 | -100,00 | ||||
| 2020-06-23 |
|
4 | STON |
Stonemor Inc.
Common Stock, par value $0.01 per share |
A - Award | 12.054.795 | 72.804.944 | 19,84 | ||||
| 2020-06-23 |
|
4 | STON |
Stonemor Inc.
Common Stock, par value $0.01 per share |
A - Award | 11.232.877 | 60.750.149 | 22,68 | 0,73 | 8.200.000 | 44.347.609 | |
| 2020-04-03 |
|
4 | STON |
Stonemor Inc.
Series A Preferred Stock, $0.01 par value per share |
A - Award | 176 | 176 | 50.000,00 | 8.800.000 | 8.800.000 | ||
| 2020-03-11 | 3 | SSI |
STAGE STORES INC
Common Stock, par value $0.01 per share |
8.600.000 | ||||||||
| 2020-03-11 | 3 | SSI |
STAGE STORES INC
Common Stock, par value $0.01 per share |
8.600.000 | ||||||||
| 2020-03-11 | 3 | SSI |
STAGE STORES INC
Common Stock, par value $0.01 per share |
8.600.000 | ||||||||
| 2020-03-11 | 3 | SSI |
STAGE STORES INC
Common Stock, par value $0.01 per share |
8.600.000 | ||||||||
| 2020-03-11 | 3 | SSI |
STAGE STORES INC
Common Stock, par value $0.01 per share |
8.600.000 | ||||||||
| 2020-01-02 |
|
4 | STON |
Stonemor Inc.
Restricted Phantom Common Stock |
A - Award | 9.174 | 9.174 | |||||
| 2020-01-02 |
|
4 | STON |
Stonemor Inc.
Common Stock |
M - Exercise | 37.843.177 | 49.517.272 | 324,16 | ||||
| 2020-01-02 |
|
4 | STON |
Stonemor Inc.
Common Stock, par value $0.01 ("Common Stock") |
A - Award | 11.674.095 | 11.674.095 | |||||
| 2020-01-02 |
|
4 | STON |
STONEMOR PARTNERS LP
Restricted Phantom Units |
D - Sale to Issuer | -9.174 | 0 | -100,00 | ||||
| 2020-01-02 |
|
4 | STON |
STONEMOR PARTNERS LP
Series A Preferred Units |
M - Exercise | -37.843.177 | 0 | -100,00 | ||||
| 2020-01-02 |
|
4 | STON |
STONEMOR PARTNERS LP
Common Units |
D - Sale to Issuer | -11.674.095 | 0 | -100,00 | ||||
| 2019-10-31 |
|
4 | NYSE |
STONEMOR PARTNERS LP
Common Units |
P - Purchase | 3.925.660 | 11.674.095 | 50,66 | 1,00 | 3.925.660 | 11.674.095 | |
| 2019-10-29 |
|
4 | STON |
STONEMOR PARTNERS LP
Series A Preferred Units |
A - Award | 37.843.177 | 37.843.177 | |||||
| 2019-10-29 |
|
4 | STON |
STONEMOR PARTNERS LP
Series A Preferred Units |
A - Award | -1.921.315 | 37.843.177 | -4,83 | 1,20 | -2.305.578 | 45.411.812 | |
| 2019-08-12 | 3 | JAKK |
JAKKS PACIFIC INC
Common Stock, par value $0.001 per share |
2.321.467 | ||||||||
| 2019-08-12 | 3 | JAKK |
JAKKS PACIFIC INC
Series A Senior Preferred Stock, par value $0.001 per share |
1.219.229 | ||||||||
| 2019-08-12 | 3 | JAKK |
JAKKS PACIFIC INC
Common Stock, par value $0.001 per share |
2.321.467 | ||||||||
| 2019-08-12 | 3 | JAKK |
JAKKS PACIFIC INC
Series A Senior Preferred Stock, par value $0.001 per share |
1.219.229 | ||||||||
| 2019-08-12 | 3 | JAKK |
JAKKS PACIFIC INC
Common Stock, par value $0.001 per share |
2.321.467 | ||||||||
| 2019-08-12 | 3 | JAKK |
JAKKS PACIFIC INC
Series A Senior Preferred Stock, par value $0.001 per share |
1.219.229 | ||||||||
| 2019-08-12 | 3 | JAKK |
JAKKS PACIFIC INC
Common Stock, par value $0.001 per share |
2.321.467 | ||||||||
| 2019-08-12 | 3 | JAKK |
JAKKS PACIFIC INC
Series A Senior Preferred Stock, par value $0.001 per share |
1.219.229 | ||||||||
| 2019-08-12 | 3 | JAKK |
JAKKS PACIFIC INC
Common Stock, par value $0.001 per share |
2.321.467 | ||||||||
| 2019-08-12 | 3 | JAKK |
JAKKS PACIFIC INC
Series A Senior Preferred Stock, par value $0.001 per share |
1.219.229 | ||||||||
| 2019-06-28 |
|
4 | STON |
STONEMOR PARTNERS LP
Series A Preferred Units |
A - Award | 39.764.492 | 39.764.492 | 1,10 | 43.899.999 | 43.899.999 | ||
| 2019-03-29 |
|
4 | NYSE |
STONEMOR PARTNERS LP
Common Units |
P - Purchase | 9.378 | 7.748.435 | 0,12 | 3.746,00 | 35.129.988 | 29.025.637.510 | |
| 2019-03-29 |
|
4 | NYSE |
STONEMOR PARTNERS LP
Equity Swaps (obligation to buy) |
J - Other | 3.825 | 1.536.717 | 0,25 | ||||
| 2019-03-29 |
|
4 | NYSE |
STONEMOR PARTNERS LP
Common Units |
P - Purchase | 9.296 | 7.739.056 | 0,12 | 3.744,00 | 34.804.224 | 28.975.025.664 | |
| 2019-03-26 |
|
4 | STON |
STONEMOR PARTNERS LP
Common Units |
P - Purchase | 12.284 | 7.729.760 | 0,16 | 3,73 | 45.832 | 28.839.735 | |
| 2019-03-26 |
|
4 | STON |
STONEMOR PARTNERS LP
Common Units |
P - Purchase | 6.142 | 7.717.476 | 0,08 | 3,71 | 22.775 | 28.616.401 | |
| 2019-03-26 |
|
4 | STON |
STONEMOR PARTNERS LP
Equity Swaps (obligation to buy) |
J - Other | 6.851 | 1.532.892 | 0,45 | ||||
| 2019-03-26 |
|
4 | STON |
STONEMOR PARTNERS LP
Common Units |
P - Purchase | 15.023 | 7.711.334 | 0,20 | 3,74 | 56.186 | 28.840.389 | |
| 2019-03-20 |
|
4 | STON |
STONEMOR PARTNERS LP
Common Units |
P - Purchase | 14.608 | 7.696.311 | 0,19 | 3,74 | 54.619 | 28.776.507 | |
| 2019-03-20 |
|
4 | STON |
STONEMOR PARTNERS LP
Common Units |
P - Purchase | 13.778 | 7.681.703 | 0,18 | 3,75 | 51.612 | 28.775.659 | |
| 2019-03-20 |
|
4 | STON |
STONEMOR PARTNERS LP
Equity Swaps (obligation to buy) |
J - Other | 5.892 | 1.526.041 | 0,39 | ||||
| 2019-03-20 |
|
4 | STON |
STONEMOR PARTNERS LP
Common Units |
P - Purchase | 377 | 7.667.925 | 0,00 | 3,75 | 1.414 | 28.754.719 | |
| 2019-03-18 |
|
4 | STON |
STONEMOR PARTNERS LP
Common Units |
P - Purchase | 1.328 | 7.667.548 | 0,02 | 3,73 | 4.951 | 28.584.619 | |
| 2019-03-18 |
|
4 | STON |
STONEMOR PARTNERS LP
Equity Swaps (obligation to buy) |
J - Other | 1.496 | 1.520.149 | 0,10 | ||||
| 2019-03-18 |
|
4 | STON |
STONEMOR PARTNERS LP
Common Units |
P - Purchase | 5.976 | 7.666.220 | 0,08 | 3,75 | 22.398 | 28.732.993 | |
| 2019-03-12 |
|
4 | STON |
STONEMOR PARTNERS LP
Common Units |
P - Purchase | 415 | 7.660.244 | 0,01 | 3,69 | 1.531 | 28.266.300 | |
| 2019-03-12 |
|
4 | STON |
STONEMOR PARTNERS LP
Common Units |
P - Purchase | 4.980 | 7.659.829 | 0,07 | 3,70 | 18.401 | 28.303.068 | |
| 2019-03-12 |
|
4 | STON |
STONEMOR PARTNERS LP
Equity Swaps (obligation to buy) |
J - Other | 2.584 | 1.518.653 | 0,17 | ||||
| 2019-03-12 |
|
4 | STON |
STONEMOR PARTNERS LP
Common Units |
P - Purchase | 7.221 | 7.654.849 | 0,09 | 3,74 | 27.035 | 28.659.755 | |
| 2019-03-05 |
|
4 | STON |
STONEMOR PARTNERS LP
Equity Swaps (obligation to buy) |
J - Other | 17 | 1.516.069 | 0,00 | ||||
| 2019-03-05 |
|
4 | STON |
STONEMOR PARTNERS LP
Common Units |
P - Purchase | 83 | 7.647.628 | 0,00 | 3,75 | 311 | 28.678.605 | |
| 2019-02-28 |
|
4 | STON |
STONEMOR PARTNERS LP
Common Units |
P - Purchase | 29.467 | 7.647.545 | 0,39 | 3,74 | 110.295 | 28.624.761 | |
| 2019-02-28 |
|
4 | STON |
STONEMOR PARTNERS LP
Common Units |
P - Purchase | 35.429 | 7.618.078 | 0,47 | 3,74 | 132.504 | 28.491.612 | |
| 2019-02-28 |
|
4 | STON |
STONEMOR PARTNERS LP
Equity Swaps (obligation to buy) |
J - Other | 26.892 | 1.516.052 | 1,81 | ||||
| 2019-02-28 |
|
4 | STON |
STONEMOR PARTNERS LP
Common Units |
P - Purchase | 66.400 | 7.582.649 | 0,88 | 3,74 | 248.535 | 28.381.855 | |
| 2019-02-25 |
|
4 | STON |
STONEMOR PARTNERS LP
Common Units |
P - Purchase | 2.158 | 7.516.249 | 0,03 | 3,74 | 8.082 | 28.148.353 | |
| 2019-02-25 |
|
4 | STON |
STONEMOR PARTNERS LP
Equity Swaps (obligation to buy) |
J - Other | 2.346 | 1.489.160 | 0,16 | ||||
| 2019-02-25 |
|
4 | STON |
STONEMOR PARTNERS LP
Common Units |
P - Purchase | 9.296 | 7.514.091 | 0,12 | 3,59 | 33.373 | 26.975.587 | |
| 2019-02-20 |
|
4 | STON |
STONEMOR PARTNERS LP
Common Units |
P - Purchase | 4.621 | 7.504.795 | 0,06 | 3,49 | 16.113 | 26.169.220 | |
| 2019-02-20 |
|
4 | STON |
STONEMOR PARTNERS LP
Common Units |
P - Purchase | 24.900 | 7.500.174 | 0,33 | 3,46 | 86.204 | 25.965.602 | |
| 2019-02-20 |
|
4 | STON |
STONEMOR PARTNERS LP
Equity Swaps (obligation to buy) |
J - Other | 11.146 | 1.486.814 | 0,76 | ||||
| 2019-02-20 |
|
4 | STON |
STONEMOR PARTNERS LP
Common Units |
P - Purchase | 24.900 | 7.475.274 | 0,33 | 3,46 | 86.129 | 25.856.973 | |
| 2019-02-14 |
|
4 | STON |
STONEMOR PARTNERS LP
Common Units |
P - Purchase | 12.450 | 7.450.374 | 0,17 | 3,48 | 43.264 | 25.890.050 | |
| 2019-02-14 |
|
4 | STON |
STONEMOR PARTNERS LP
Common Units |
P - Purchase | 24.900 | 7.437.924 | 0,34 | 3,36 | 83.589 | 24.969.111 | |
| 2019-02-14 |
|
4 | STON |
STONEMOR PARTNERS LP
Equity Swaps (obligation to buy) |
J - Other | 8.551 | 1.475.668 | 0,58 | ||||
| 2019-02-14 |
|
4 | STON |
STONEMOR PARTNERS LP
Common Units |
P - Purchase | 4.399 | 7.413.024 | 0,06 | 3,24 | 14.235 | 23.988.546 | |
| 2019-02-11 |
|
4 | STON |
STONEMOR PARTNERS LP
Common Units |
P - Purchase | 1.245 | 7.408.625 | 0,02 | 3,24 | 4.035 | 24.011.354 | |
| 2019-02-11 |
|
4 | STON |
STONEMOR PARTNERS LP
Common Units |
P - Purchase | 4.150 | 7.407.380 | 0,06 | 3,24 | 13.467 | 24.036.948 | |
| 2019-02-11 |
|
4 | STON |
STONEMOR PARTNERS LP
Equity Swaps (obligation to buy) |
J - Other | 4.845 | 1.467.117 | 0,33 | ||||
| 2019-02-11 |
|
4 | STON |
STONEMOR PARTNERS LP
Common Units |
P - Purchase | 18.260 | 7.403.230 | 0,25 | 3,12 | 57.026 | 23.120.287 | |
| 2018-10-31 |
|
4 | STON |
STONEMOR PARTNERS LP
Common Units |
P - Purchase | 33.000 | 7.384.970 | 0,45 | 5,45 | 179.850 | 40.248.086 | |
| 2018-10-31 |
|
4 | STON |
STONEMOR PARTNERS LP
Common Units |
P - Purchase | 28.203 | 7.351.970 | 0,39 | 5,36 | 151.168 | 39.406.559 | |
| 2018-10-31 |
|
4 | STON |
STONEMOR PARTNERS LP
Equity Swaps (obligation to buy) |
J - Other | 22.983 | 1.462.272 | 1,60 | ||||
| 2018-10-31 |
|
4 | STON |
STONEMOR PARTNERS LP
Common Units |
P - Purchase | 30.000 | 7.323.767 | 0,41 | 5,46 | 163.740 | 39.973.120 | |
| 2018-10-26 |
|
4 | STON |
STONEMOR PARTNERS LP
Common Units |
P - Purchase | 30.000 | 7.293.767 | 0,41 | 5,39 | 161.730 | 39.320.698 | |
| 2018-10-26 |
|
4 | STON |
STONEMOR PARTNERS LP
Common Units |
P - Purchase | 30.000 | 7.263.767 | 0,41 | 5,35 | 160.530 | 38.868.417 | |
| 2018-10-26 |
|
4 | STON |
STONEMOR PARTNERS LP
Equity Swaps (obligation to buy) |
J - Other | 25.000 | 1.439.289 | 1,77 | ||||
| 2018-10-26 |
|
4 | STON |
STONEMOR PARTNERS LP
Common Units |
P - Purchase | 34.000 | 7.233.767 | 0,47 | 5,41 | 184.008 | 39.149.147 | |
| 2018-10-23 |
|
4 | STON |
STONEMOR PARTNERS LP
Common Units |
P - Purchase | 35.000 | 7.199.767 | 0,49 | 5,42 | 189.875 | 39.058.736 | |
| 2018-10-23 |
|
4 | STON |
STONEMOR PARTNERS LP
Common Units |
P - Purchase | 35.000 | 7.164.767 | 0,49 | 5,44 | 190.505 | 38.997.827 | |
| 2018-10-23 |
|
4 | STON |
STONEMOR PARTNERS LP
Equity Swaps (obligation to buy) |
J - Other | 12.000 | 1.414.289 | 0,86 | ||||
| 2018-10-23 |
|
4 | STON |
STONEMOR PARTNERS LP
Common Units |
P - Purchase | 35.000 | 7.129.767 | 0,49 | 5,34 | 186.760 | 38.044.437 | |
| 2018-10-18 |
|
4 | STON |
STONEMOR PARTNERS LP
Common Units |
P - Purchase | 35.000 | 7.094.767 | 0,50 | 5.068,00 | 177.380.000 | 35.956.279.156 | |
| 2018-10-18 |
|
4 | STON |
STONEMOR PARTNERS LP
Common Units |
P - Purchase | 20.000 | 7.059.767 | 0,28 | 4,97 | 99.340 | 35.065.863 | |
| 2018-10-18 |
|
4 | STON |
STONEMOR PARTNERS LP
Equity Swaps (obligation to buy) |
J - Other | 10.904 | 1.402.289 | 0,78 | ||||
| 2018-10-18 |
|
4 | STON |
STONEMOR PARTNERS LP
Common Units |
P - Purchase | 7.616 | 7.039.767 | 0,11 | 5,28 | 40.251 | 37.205.169 | |
| 2018-10-15 |
|
4 | STON |
STONEMOR PARTNERS LP
Common Units |
P - Purchase | 1.600 | 7.032.151 | 0,02 | 5,38 | 8.606 | 37.825.940 | |
| 2018-10-15 |
|
4 | STON |
STONEMOR PARTNERS LP
Common Units |
P - Purchase | 51.225 | 7.030.551 | 0,73 | 5,33 | 272.876 | 37.451.745 | |
| 2018-10-15 |
|
4 | STON |
STONEMOR PARTNERS LP
Equity Swaps (obligation to buy) |
J - Other | 15.760 | 1.391.385 | 1,15 | ||||
| 2018-10-15 |
|
4 | STON |
STONEMOR PARTNERS LP
Common Units |
P - Purchase | 10.216 | 6.979.326 | 0,15 | 5,19 | 53.062 | 36.250.619 | |
| 2018-10-10 |
|
4 | STON |
STONEMOR PARTNERS LP
Common Units |
P - Purchase | 27.120 | 6.969.110 | 0,39 | 5,19 | 140.753 | 36.169.681 | |
| 2018-10-10 |
|
4 | STON |
STONEMOR PARTNERS LP
Common Units |
P - Purchase | 19.051 | 6.941.990 | 0,28 | 5,15 | 98.170 | 35.772.074 | |
| 2018-10-10 |
|
4 | STON |
STONEMOR PARTNERS LP
Equity Swaps (obligation to buy) |
J - Other | 13.664 | 1.375.625 | 1,00 | ||||
| 2018-10-10 |
|
4 | STON |
STONEMOR PARTNERS LP
Common Units |
P - Purchase | 8.483 | 6.922.939 | 0,12 | 5,19 | 44.052 | 35.950.822 | |
| 2018-10-05 |
|
4 | STON |
STONEMOR PARTNERS LP
Common Units |
P - Purchase | 6.400 | 6.914.456 | 0,09 | 5,15 | 32.986 | 35.637.106 | |
| 2018-10-05 |
|
4 | STON |
STONEMOR PARTNERS LP
Common Units |
P - Purchase | 10.632 | 6.908.056 | 0,15 | 5,19 | 55.223 | 35.880.443 | |
| 2018-10-05 |
|
4 | STON |
STONEMOR PARTNERS LP
Equity Swaps (obligation to buy) |
J - Other | 4.781 | 1.361.961 | 0,35 | ||||
| 2018-10-05 |
|
4 | STON |
STONEMOR PARTNERS LP
Common Units |
P - Purchase | 2.091 | 6.897.424 | 0,03 | 5,17 | 10.802 | 35.632.092 | |
| 2018-10-02 |
|
4 | STON |
STONEMOR PARTNERS LP
Common Units |
P - Purchase | 16.000 | 6.895.333 | 0,23 | 5,14 | 82.224 | 35.435.116 | |
| 2018-10-02 |
|
4 | STON |
STONEMOR PARTNERS LP
Common Units |
P - Purchase | 6.560 | 6.879.333 | 0,10 | 4,99 | 32.761 | 34.355.389 | |
| 2018-10-02 |
|
4 | STON |
STONEMOR PARTNERS LP
Equity Swaps (obligation to buy) |
J - Other | 61.180 | 1.357.180 | 4,72 | ||||
| 2018-09-28 |
|
4 | STON |
STONEMOR PARTNERS LP
Common Units |
P - Purchase | 800 | 6.872.773 | 0,01 | 4,48 | 3.588 | 30.824.387 | |
| 2018-09-28 |
|
4 | STON |
STONEMOR PARTNERS LP
Common Units |
P - Purchase | 2.320 | 6.871.973 | 0,03 | 4,47 | 10.362 | 30.693.667 | |
| 2018-09-28 |
|
4 | STON |
STONEMOR PARTNERS LP
Common Units |
P - Purchase | 4.640 | 6.869.653 | 0,07 | 4,50 | 20.865 | 30.890.769 | |
| 2018-09-28 |
|
4 | STON |
STONEMOR PARTNERS LP
Common Units |
P - Purchase | 14.400 | 6.865.013 | 0,21 | 4,47 | 64.405 | 30.704.457 | |
| 2018-09-28 |
|
4 | STON |
STONEMOR PARTNERS LP
Common Units |
P - Purchase | 6.420 | 6.850.613 | 0,09 | 4,34 | 27.836 | 29.702.888 | |
| 2018-09-28 |
|
4 | STON |
STONEMOR PARTNERS LP
Common Units |
P - Purchase | 20.000 | 6.844.193 | 0,29 | 4,44 | 88.700 | 30.353.996 | |
| 2018-09-28 |
|
4 | STON |
STONEMOR PARTNERS LP
Common Units |
P - Purchase | 16.071 | 6.824.193 | 0,24 | 4,49 | 72.138 | 30.631.755 | |
| 2018-09-28 |
|
4 | STON |
STONEMOR PARTNERS LP
Common Units |
P - Purchase | 10.400 | 6.808.122 | 0,15 | 4,44 | 46.226 | 30.260.741 | |
| 2018-09-28 |
|
4 | STON |
STONEMOR PARTNERS LP
Common Units |
P - Purchase | 9.795 | 6.797.722 | 0,14 | 4,48 | 43.931 | 30.487.783 | |
| 2018-09-28 |
|
4 | STON |
STONEMOR PARTNERS LP
Common Units |
P - Purchase | 19.200 | 6.787.927 | 0,28 | 4,54 | 87.164 | 30.815.831 | |
| 2018-09-28 |
|
4 | STON |
STONEMOR PARTNERS LP
Common Units |
P - Purchase | 10.478 | 6.768.727 | 0,16 | 4,42 | 46.305 | 29.913.035 | |
| 2018-09-28 |
|
4 | STON |
STONEMOR PARTNERS LP
Common Units |
P - Purchase | 20.000 | 6.758.249 | 0,30 | 4,45 | 89.068 | 30.097.186 | |
| 2018-09-28 |
|
4 | STON |
STONEMOR PARTNERS LP
Common Units |
P - Purchase | 13.772 | 6.738.249 | 0,20 | 4,47 | 61.610 | 30.144.231 | |
| 2018-09-28 |
|
4 | STON |
STONEMOR PARTNERS LP
Common Units |
P - Purchase | 20.000 | 6.724.477 | 0,30 | 4,46 | 89.190 | 29.987.805 | |
| 2018-09-28 |
|
4 | STON |
STONEMOR PARTNERS LP
Common Units |
P - Purchase | 1.571 | 6.704.477 | 0,02 | 4,49 | 7.054 | 30.103.772 | |
| 2018-09-28 |
|
4 | STON |
STONEMOR PARTNERS LP
Common Units |
P - Purchase | 2.044 | 6.702.906 | 0,03 | 4,50 | 9.192 | 30.144.979 | |
| 2018-09-28 |
|
4 | STON |
STONEMOR PARTNERS LP
Common Units |
P - Purchase | 3.308 | 6.700.862 | 0,05 | 4,49 | 14.859 | 30.098.262 | |
| 2018-09-28 |
|
4 | STON |
STONEMOR PARTNERS LP
Common Units |
P - Purchase | 4.240 | 6.697.554 | 0,06 | 4,50 | 19.059 | 30.106.175 | |
| 2018-09-28 |
|
4 | STON |
STONEMOR PARTNERS LP
Common Units |
P - Purchase | 10.717 | 6.693.314 | 0,16 | 4,49 | 48.121 | 30.054.319 | |
| 2018-09-28 |
|
4 | STON |
STONEMOR PARTNERS LP
Common Units |
P - Purchase | 2.176 | 6.682.597 | 0,03 | 4,48 | 9.747 | 29.934.693 | |
| 2018-09-28 |
|
4 | STON |
STONEMOR PARTNERS LP
Common Units |
P - Purchase | 640 | 6.680.421 | 0,01 | 4,50 | 2.880 | 30.061.894 | |
| 2018-09-28 |
|
4 | STON |
STONEMOR PARTNERS LP
Common Units |
P - Purchase | 400 | 6.679.781 | 0,01 | 4,50 | 1.800 | 30.059.014 | |
| 2018-09-28 |
|
4 | STON |
STONEMOR PARTNERS LP
Common Units |
P - Purchase | 12.800 | 6.679.381 | 0,19 | 4,47 | 57.153 | 29.824.104 | |
| 2018-09-28 |
|
4 | STON |
STONEMOR PARTNERS LP
Common Units |
P - Purchase | 400 | 6.666.581 | 0,01 | 4,50 | 1.800 | 29.999.614 | |
| 2018-09-28 |
|
4 | STON |
STONEMOR PARTNERS LP
Common Units |
P - Purchase | 1.520 | 6.666.181 | 0,02 | 4,50 | 6.840 | 29.997.814 | |
| 2018-09-28 |
|
4 | STON |
STONEMOR PARTNERS LP
Common Units |
P - Purchase | 7.200 | 6.664.661 | 0,11 | 4,49 | 32.306 | 29.903.667 | |
| 2018-09-28 |
|
4 | STON |
STONEMOR PARTNERS LP
Common Units |
P - Purchase | 6.848 | 6.657.461 | 0,10 | 4,35 | 29.821 | 28.991.245 | |
| 2018-03-09 | 3 | STON |
STONEMOR PARTNERS LP
Common Units Representing Limited Partnership Interests |
13.301.226 | ||||||||
| 2018-03-09 | 3 | STON |
STONEMOR PARTNERS LP
Common Units Representing Limited Partnership Interests |
13.301.226 | ||||||||
| 2018-03-09 | 3 | STON |
STONEMOR PARTNERS LP
Common Units Representing Limited Partnership Interests |
13.301.226 | ||||||||
| 2018-03-09 | 3 | STON |
STONEMOR PARTNERS LP
Common Units Representing Limited Partnership Interests |
13.301.226 | ||||||||
| 2017-01-30 |
|
4 | AXAR |
Axar Acquisition Corp.
Private Placement Warrants (Right to Buy) |
S - Sale | -1.310.000 | 5.240.000 | -20,00 | ||||
| 2017-01-30 |
|
4 | AXAR |
Axar Acquisition Corp.
Common Stock |
S - Sale | -1.189.565 | 6.108.262 | -16,30 | ||||
| 2017-01-30 |
|
4 | AXAR |
Axar Acquisition Corp.
Warrants (Right to Buy) |
J - Other | 675.000 | 675.000 | |||||
| 2016-12-23 |
|
4 | RJETQ |
REPUBLIC AIRWAYS HOLDINGS INC
Common Stock, par value $0.001 per share |
S - Sale | -2.023.000 | 20.230.000 | -9,09 | ||||
| 2016-12-23 |
|
4 | RJETQ |
REPUBLIC AIRWAYS HOLDINGS INC
Common Stock, par value $0.001 per share |
S - Sale | -2.023.000 | 20.230.000 | -9,09 | ||||
| 2016-12-23 |
|
4 | RJETQ |
REPUBLIC AIRWAYS HOLDINGS INC
Common Stock, par value $0.001 per share |
S - Sale | -2.023.000 | 0 | -100,00 | ||||
| 2016-12-23 |
|
4 | RJETQ |
REPUBLIC AIRWAYS HOLDINGS INC
Common Stock, par value $0.001 per share |
S - Sale | -2.023.000 | 0 | -100,00 | ||||
| 2016-12-23 |
|
4 | RJETQ |
REPUBLIC AIRWAYS HOLDINGS INC
Common Stock, par value $0.001 per share |
S - Sale | -2.023.000 | 0 | -100,00 | ||||
| 2016-10-12 | 3 | AXAR |
AR CAPITAL ACQUISITION
Common Stock |
14.595.654 | ||||||||
| 2016-10-12 | 3 | AXAR |
AR CAPITAL ACQUISITION
Common Stock |
14.595.654 | ||||||||
| 2016-10-12 | 3 | AXAR |
AR CAPITAL ACQUISITION
Common Stock |
14.595.654 | ||||||||
| 2016-10-12 | 3 | AXAR |
AR CAPITAL ACQUISITION
Common Stock |
14.595.654 | ||||||||
| 2016-09-22 | 3 | RJET |
REPUBLIC AIRWAYS HOLDINGS INC
Common Stock, par value $0.001 per share |
20.230.000 | ||||||||
| 2016-09-22 | 3 | RJET |
REPUBLIC AIRWAYS HOLDINGS INC
Common Stock, par value $0.001 per share |
20.230.000 | ||||||||
| 2016-09-22 | 3 | RJET |
REPUBLIC AIRWAYS HOLDINGS INC
Common Stock, par value $0.001 per share |
20.230.000 | ||||||||
| 2016-09-22 | 3 | RJET |
REPUBLIC AIRWAYS HOLDINGS INC
Common Stock, par value $0.001 per share |
20.230.000 |
P
Pasar terbuka atau pembelian swasta atas sekuritas non-derivatif atau derivatif
S
Pasar terbuka atau penjualan pribadi atas sekuritas non-derivatif atau derivatif
A
Hibah, penghargaan, atau perolehan sekuritas lainnya dari perusahaan (seperti opsi)
C
Konversi derivatif
D
Penjualan atau pengalihan surat berharga kembali kepada perusahaan
F
Pembayaran harga pelaksanaan atau kewajiban perpajakan dengan menggunakan sebagian surat berharga yang diterima dari perusahaan
G
Pemberian surat berharga oleh atau kepada insider
K
Swap ekuitas dan transaksi lindung nilai serupa
M
Penggunaan atau konversi sekuritas derivatif yang diterima dari perusahaan (seperti opsi)
V
Suatu transaksi dilaporkan secara sukarela pada Formulir 4
J
Lainnya (disertai catatan kaki yang menjelaskan transaksi)