Statistik Dasar
| Saham Institusi (Long) | 138.509.330 - 69,22% (ex 13D/G) - change of -38,29MM shares -21,50% MRQ |
| Nilai Institusi (Long) | $ 1.739.176 USD ($1000) |
Kepemilikan Institusi dan Pemegang Saham
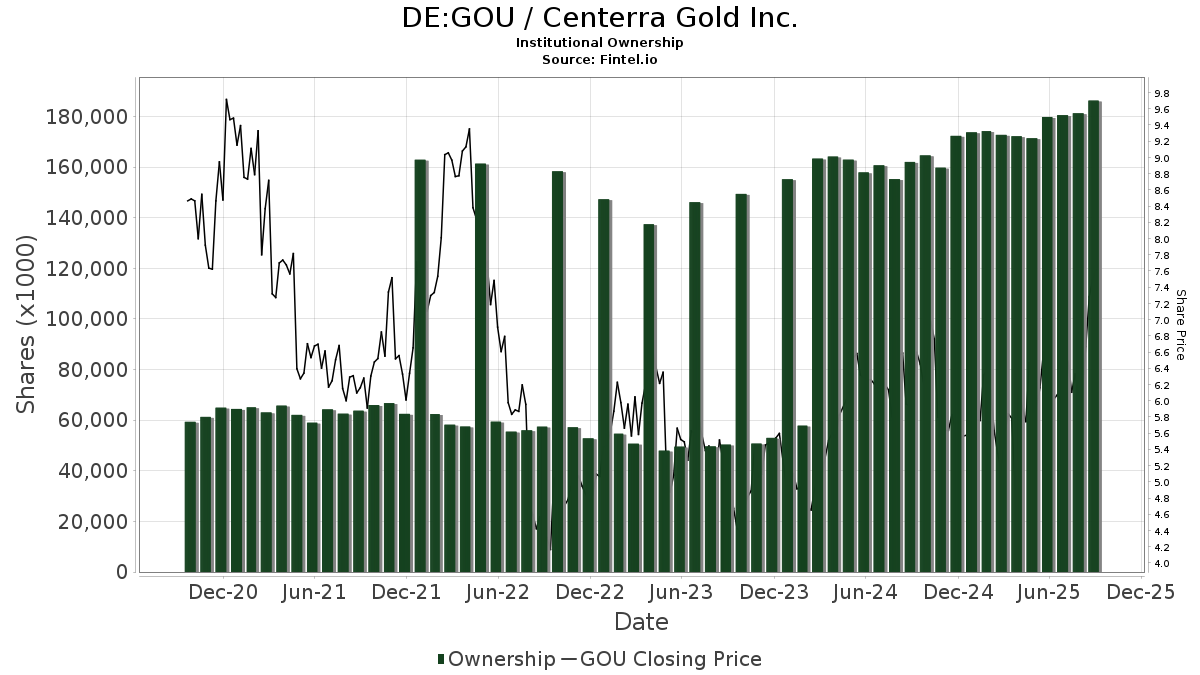
Centerra Gold Inc. (DE:GOU) punya 196 pemilik institusi dan pemegang saham yang telah mengajukan formulir 13D/G atau 13F ke Securities Exchange Commission (SEC). Institusi-institusi ini memiliki total 138,509,330 saham. Pemegang saham terbesar termasuk Donald Smith & Co., Inc., Vanguard Group Inc, Arrowstreet Capital, Limited Partnership, Acadian Asset Management Llc, Goldman Sachs Group Inc, Van Eck Associates Corp, American Century Companies Inc, Morgan Stanley, Waratah Capital Advisors Ltd., and Hillsdale Investment Management Inc. .
Centerra Gold Inc. (DB:GOU) struktur kepemilikan institusi menunjukkan posisi saat ini di perusahaan menurut institusi dan dana, serta perubahan terkini dalam ukuran posisi. Pemegang saham utama dapat mencakup investor individu, reksa dana, hedge funds, atau institusi. Jadwal 13D menunjukkan bahwa investor memegang lebih dari 5% saham perusahaan dan bermaksud untuk secara aktif melakukan perubahan dalam strategi bisnis. Jadwal 13G menunjukkan investasi pasif lebih dari 5%.
The share price as of March 25, 2026 is 14,80 / share. Previously, on March 27, 2025, the share price was 5,80 / share. This represents an increase of 155,08% over that period.
Skor Sentimen Dana
Skor Sentimen Dana (Ownership Accumulation Score) menemukan saham-saham yang paling banyak dibeli oleh dana. Hal ini merupakan hasil dari model kuantitatif multifaktor yang canggih yang mengidentifikasi perusahaan-perusahaan dengan tingkat akumulasi institusi tertinggi. Model penilaian menggunakan kombinasi total peningkatan pemilik yang diungkapkan, perubahan alokasi portofolio pada pemilik tersebut, dan metrik lainnya. Angka tersebut berkisar dari 0 hingga 100, dengan angka yang lebih tinggi menunjukkan tingkat akumulasi yang lebih tinggi terhadap rekan-rekannya, dan 50 adalah rata-ratanya.
Frekuensi Pembaruan: Harian
Lihat Penjelajah Kepemilikan, yang menyediakan daftar perusahaan dengan peringkat tertinggi.
AI+ Ask Fintel’s AI assistant about Centerra Gold Inc..
Select a question to share a public post with an AI-crafted answer.
Thinking of good questions…
Pengajuan 13F dan NPORT
Detail pengajuan 13F gratis. Detail pengajuan NP memerlukan keanggotaan premium. Baris hijau menunjukkan posisi baru. Baris merah menunjukkan posisi yang sudah ditutup. Klik tautannya ikon untuk melihat riwayat transaksi lengkap.
Upgrade
untuk membuka data premium dan mengekspor ke Excel ![]() .
.
| Tanggal Berkas | Sumber | Investor | Jenis | Harga Rata-rata (Perkiraan) |
Saham | Δ Saham (%) |
Dilaporkan Nilai ($1000) |
Δ Nilai (%) |
Alokasi Portofolio (%) |
|
|---|---|---|---|---|---|---|---|---|---|---|
| 2026-01-23 | 13F | Ritholtz Wealth Management | 147.141 | -25,90 | 2.114 | -0,75 | ||||
| 2026-02-12 | 13F | Jane Street Group, Llc | Put | 10.000 | 144 | |||||
| 2026-02-12 | 13F | Jane Street Group, Llc | 706.933 | 11,75 | 10.159 | 49,67 | ||||
| 2026-02-10 | 13F | Bank of New York Mellon Corp | 71.209 | 12,36 | 1.023 | 50,44 | ||||
| 2026-01-26 | 13F | Cwm, Llc | 16.300 | 5,30 | 0 | |||||
| 2026-01-30 | 13F | Carrera Capital Advisors | 0 | -100,00 | 0 | |||||
| 2026-02-10 | 13F | Goldman Sachs Group Inc | 8.063.254 | -18,53 | 115.869 | 9,11 | ||||
| 2026-02-09 | 13F | Geode Capital Management, Llc | 142.845 | 13,18 | 2.100 | 54,57 | ||||
| 2026-02-17 | 13F | Qube Research & Technologies Ltd | 469.819 | 97,86 | 6.751 | 165,06 | ||||
| 2026-02-12 | 13F | Nuveen, LLC | 2.708.118 | -5,63 | 39.039 | 26,95 | ||||
| 2026-02-12 | 13F | BlackRock, Inc. | 41.786 | 12.757,23 | 600 | 19.900,00 | ||||
| 2026-02-11 | 13F | Spark Investment Management LLC | 41.000 | 590 | ||||||
| 2026-02-11 | 13F | Allianz Asset Management GmbH | 199.645 | 13,39 | 2.878 | 52,55 | ||||
| 2026-02-04 | 13F | Versor Investments LP | 38.500 | 554 | ||||||
| 2026-02-10 | 13F | Acadian Asset Management Llc | 8.128.483 | -1,25 | 117 | 32,95 | ||||
| 2026-02-13 | 13F | Verition Fund Management LLC | 508.852 | 463,79 | 7.312 | 655,37 | ||||
| 2026-01-14 | 13F | Baron Wealth Management LLC | 25.981 | 10,85 | 373 | 48,61 | ||||
| 2025-10-27 | 13F | Kiker Wealth Management, LLC | 0 | -100,00 | 0 | |||||
| 2026-02-04 | 13F | D'Orazio & Associates, Inc. | 16.616 | 1,54 | 239 | 36,00 | ||||
| 2026-02-11 | 13F | Donald Smith & Co., Inc. | 14.158.116 | 21,82 | 203.452 | 63,14 | ||||
| 2026-02-04 | 13F | Swiss Life Asset Management Ltd | 23.696 | 341 | ||||||
| 2026-02-17 | 13F | Millennium Management Llc | 643.093 | -72,90 | 9.248 | -63,64 | ||||
| 2026-02-13 | 13F | JustInvest LLC | 36.939 | 2,06 | 531 | 36,60 | ||||
| 2026-02-17 | 13F | MIRAE ASSET GLOBAL ETFS HOLDINGS Ltd. | 162.726 | 3,97 | 2.346 | 39,83 | ||||
| 2026-01-13 | 13F | Kathmere Capital Management, LLC | 15.405 | 0,00 | 221 | 33,94 | ||||
| 2025-11-13 | 13F | Prudential Financial Inc | 0 | -100,00 | 0 | |||||
| 2025-09-29 | NP | AIM SECTOR FUNDS (INVESCO SECTOR FUNDS) - Invesco Oppenheimer Gold & Special Minerals Fund Class C | 2.550.000 | 12,33 | 17.355 | 14,19 | ||||
| 2026-02-09 | 13F | Kingsview Wealth Management, LLC | 30.862 | 443 | ||||||
| 2026-02-13 | 13F | Towarzystwo Funduszy Inwestycyjnych Pzu Sa | 18.000 | 0,00 | 260 | 34,90 | ||||
| 2026-02-12 | 13F | Skopos Labs, Inc. | 18.150 | 261 | ||||||
| 2026-02-13 | 13F | Smartleaf Asset Management LLC | 1.385 | 20 | ||||||
| 2026-01-28 | 13F | CAPROCK Group, Inc. | 13.176 | -27,73 | 189 | 26,85 | ||||
| 2026-03-12 | 13F/A | Peak6 Llc | Call | 205.700 | 2.956 | |||||
| 2026-02-17 | 13F | Engineers Gate Manager LP | 88.502 | 15,21 | 1.272 | 54,43 | ||||
| 2026-02-12 | 13F | Swiss National Bank | 403.400 | 0,00 | 5.819 | 34,61 | ||||
| 2026-01-30 | 13F | Us Bancorp \de\ | 296 | 0,00 | 4 | 33,33 | ||||
| 2026-02-12 | 13F | Federation des caisses Desjardins du Quebec | 10.886 | -9,05 | 156 | 26,02 | ||||
| 2026-02-06 | 13F | Global Retirement Partners, LLC | 2.518 | 36 | ||||||
| 2025-11-12 | 13F | Cambria Investment Management, L.P. | 497.705 | 0,00 | 3.585 | 0,00 | ||||
| 2026-01-15 | 13F | Allspring Global Investments Holdings, LLC | 50.000 | 0,00 | 720 | 34,39 | ||||
| 2026-02-06 | 13F | Larson Financial Group LLC | 1.452 | -2,29 | 21 | 33,33 | ||||
| 2026-02-06 | 13F | Profund Advisors Llc | 20.726 | -17,38 | 298 | 10,41 | ||||
| 2026-02-10 | 13F | Td Asset Management Inc | 770.777 | -48,24 | 11.111 | -30,37 | ||||
| 2026-02-10 | 13F | Connor, Clark & Lunn Investment Management Ltd. | 2.096.944 | 32,35 | 30.189 | 77,89 | ||||
| 2026-02-13 | 13F | Entropy Technologies, LP | 16.791 | 241 | ||||||
| 2026-02-17 | 13F | Royal Bank Of Canada | 1.063.220 | -75,24 | 15.277 | -66,85 | ||||
| 2026-02-05 | 13F | Bessemer Group Inc | 191.423 | 0,59 | 3 | 0,00 | ||||
| 2026-02-13 | 13F | Citigroup Inc | 50.886 | -24,42 | 734 | 1,66 | ||||
| 2026-02-13 | 13F/A | Alberta Investment Management Corp | 0 | -100,00 | 0 | |||||
| 2026-02-12 | 13F | Northwest & Ethical Investments L.P. | 98.979 | 13,03 | 1.425 | 51,92 | ||||
| 2026-02-13 | 13F | Charles Schwab Investment Management Inc | 805.208 | -6,75 | 11.607 | 25,45 | ||||
| 2026-02-13 | 13F | Brooklands Fund Management Ltd | Call | 0 | -100,00 | 0 | ||||
| 2026-02-12 | 13F | Pinnacle Holdings, LLC | 0 | -100,00 | 0 | |||||
| 2025-11-12 | 13F | Picton Mahoney Asset Management | 0 | -100,00 | 0 | |||||
| 2026-02-13 | 13F | Causeway Capital Management Llc | 1.249.789 | 44,76 | 18.016 | 94,75 | ||||
| 2026-02-18 | 13F | GWM Advisors LLC | 93 | 1,09 | 1 | |||||
| 2026-02-17 | 13F | Artisan Partners Limited Partnership | 0 | -100,00 | 0 | |||||
| 2026-02-13 | 13F | Manufacturers Life Insurance Company, The | 796.734 | 5,83 | 11.494 | 42,48 | ||||
| 2026-02-13 | 13F | Cornerstone Financial Management LLC | 121 | 2 | ||||||
| 2026-02-12 | 13F | Marex Group plc | 13.900 | 200 | ||||||
| 2026-02-02 | 13F | Intact Investment Management Inc. | 1.514.820 | 166,74 | 21.807 | 258,43 | ||||
| 2026-02-11 | 13F | Vise Technologies, Inc. | 10.217 | -26,98 | 147 | -2,67 | ||||
| 2026-02-10 | 13F | Quantbot Technologies LP | 124.926 | -63,88 | 1.795 | -51,62 | ||||
| 2026-02-13 | 13F | Barclays Plc | 307.453 | -22,07 | 4.418 | 4,37 | ||||
| 2026-02-17 | 13F | Aqr Capital Management Llc | 219.877 | 3.166 | ||||||
| 2026-02-17 | 13F | Armistice Capital, Llc | 10.301 | 148 | ||||||
| 2026-02-12 | 13F | Bank Of Montreal /can/ | Put | 0 | -100,00 | 0 | -100,00 | |||
| 2026-02-10 | 13F | Savant Capital, LLC | 23.758 | 7,26 | 341 | 43,88 | ||||
| 2026-02-10 | 13F | Jupiter Asset Management Ltd | 427.969 | 3,97 | 6.169 | 39,89 | ||||
| 2026-02-17 | 13F | Voloridge Investment Management, Llc | 65.336 | 939 | ||||||
| 2026-02-17 | 13F | SIG North Trading, ULC | 139.016 | -47,26 | 1.998 | -29,38 | ||||
| 2026-02-17 | 13F | SIG North Trading, ULC | Call | 52.000 | -6,64 | 747 | 25,13 | |||
| 2026-02-13 | 13F | Public Sector Pension Investment Board | 0 | -100,00 | 0 | |||||
| 2026-02-12 | 13F | Groupe la Francaise | 570.000 | 7,49 | 8.204 | 44,27 | ||||
| 2026-02-11 | 13F | Deutsche Bank Ag\ | 25.176 | -95,20 | 362 | -93,58 | ||||
| 2026-02-13 | 13F | Morgan Stanley | 4.023.485 | -0,99 | 57.817 | 32,59 | ||||
| 2025-10-29 | 13F | AMH Equity Ltd | 0 | -100,00 | 0 | |||||
| 2026-02-11 | 13F | Tradition Wealth Management, LLC | 10.000 | 144 | ||||||
| 2025-10-29 | 13F | AMH Equity Ltd | Call | 0 | -100,00 | 0 | ||||
| 2026-01-27 | 13F | Zurcher Kantonalbank (Zurich Cantonalbank) | 75.009 | 8,66 | 1.081 | 46,28 | ||||
| 2026-02-13 | 13F | Ubs Asset Management Americas Inc | 108.110 | 1.554 | ||||||
| 2026-02-09 | 13F | Legal & General Group Plc | 1.038.763 | -4,00 | 14.974 | 29,14 | ||||
| 2026-02-17 | 13F | Knoll Capital Management, LLC | 497.402 | 0,00 | 7.148 | 33,91 | ||||
| 2026-02-17 | 13F | Investment Management Corp of Ontario | 24.721 | 355 | ||||||
| 2026-02-17 | 13F | Prelude Capital Management, Llc | 0 | -100,00 | 0 | |||||
| 2026-02-17 | 13F | Grantham, Mayo, Van Otterloo & Co. LLC | 346.071 | 228,68 | 4.973 | 340,48 | ||||
| 2026-02-13 | 13F | Van Eck Associates Corp | 6.536.157 | 15,29 | 94 | 55,00 | ||||
| 2026-02-17 | 13F | Public Employees Retirement System Of Ohio | 762.571 | -0,72 | 10.992 | 33,53 | ||||
| 2025-11-14 | 13F | Capula Management Ltd | 0 | -100,00 | 0 | |||||
| 2026-02-13 | 13F | OMERS ADMINISTRATION Corp | 0 | -100,00 | 0 | |||||
| 2026-03-06 | 13F | Hsbc Holdings Plc | 0 | -100,00 | 0 | |||||
| 2026-01-29 | 13F | IMC-Chicago, LLC | 46.160 | 663 | ||||||
| 2026-02-17 | 13F | D. E. Shaw & Co., Inc. | 747.179 | -32,39 | 10.758 | -9,12 | ||||
| 2026-02-17 | 13F | Susquehanna Advisors Group, Inc. | 0 | -100,00 | 0 | |||||
| 2026-02-05 | 13F | Cambridge Investment Research Advisors, Inc. | 69.151 | 28,96 | 1 | |||||
| 2026-02-17 | 13F | Trexquant Investment LP | 254.453 | 389,75 | 3.656 | 556,37 | ||||
| 2025-11-14 | 13F | ExodusPoint Capital Management, LP | 28.600 | -28,10 | 307 | |||||
| 2026-02-18 | 13F | Mackenzie Financial Corp | 1.264.565 | 677,07 | 18.300 | 949,86 | ||||
| 2026-02-11 | 13F | Simplex Trading, Llc | 17.498 | -90,08 | 251 | 25.000,00 | ||||
| 2026-02-17 | 13F | Raymond James Financial Inc | 31.182 | 10,65 | 448 | 48,34 | ||||
| 2026-02-03 | 13F | SBI Securities Co., Ltd. | 439 | 0,69 | 6 | 50,00 | ||||
| 2025-11-13 | 13F | Dynamic Technology Lab Private Ltd | 0 | -100,00 | 0 | |||||
| 2025-11-14 | 13F | Cubist Systematic Strategies, LLC | 151.335 | 66,54 | 1.623 | 147,79 | ||||
| 2026-01-27 | 13F | TD Waterhouse Canada Inc. | 345 | -88,42 | 5 | -87,88 | ||||
| 2026-02-17 | 13F | Point72 Asset Management, L.P. | 246.612 | -0,96 | 3.547 | 32,85 | ||||
| 2026-02-17 | 13F | Numerai GP LLC | 23.496 | 133,21 | 338 | 212,04 | ||||
| 2026-02-12 | 13F | Bank Of Montreal /can/ | Call | 6.400 | -74,30 | 92 | -65,41 | |||
| 2026-02-12 | 13F | Bank Of Montreal /can/ | 2.855.030 | 0,63 | 41.103 | 35,26 | ||||
| 2026-01-29 | 13F | Ashton Thomas Private Wealth, LLC | 24.187 | -25,25 | 349 | 0,58 | ||||
| 2026-02-13 | 13F | C M Bidwell & Associates Ltd | 6.925 | 100 | ||||||
| 2026-02-03 | 13F | International Assets Investment Management, Llc | 10.212 | 147 | ||||||
| 2026-01-05 | 13F | Burkett Financial Services, Llc | 3.569 | 27,46 | 51 | 70,00 | ||||
| 2026-02-19 | 13F | Invesco Ltd. | 2.981.473 | -0,25 | 42.844 | 33,59 | ||||
| 2026-02-17 | 13F | Lighthouse Investment Partners, LLC | 0 | -100,00 | 0 | |||||
| 2026-01-14 | 13F | ORG Partners LLC | 1.005 | 20,36 | 14 | 75,00 | ||||
| 2026-02-17 | 13F | Advisor Group Holdings, Inc. | 21.706 | -2,66 | 312 | 38,67 | ||||
| 2026-01-20 | 13F | Polunin Capital Partners Ltd | 491.629 | -4,67 | 8 | 60,00 | ||||
| 2026-02-17 | 13F | Merewether Investment Management, LP | 2.253.100 | 32.439 | ||||||
| 2025-11-12 | 13F | Insigneo Advisory Services, Llc | 0 | -100,00 | 0 | |||||
| 2026-02-13 | 13F | Arrowstreet Capital, Limited Partnership | 8.274.935 | 7,11 | 119.058 | 43,80 | ||||
| 2026-02-17 | 13F | Bank Of America Corp /de/ | 2.486.217 | 2,77 | 35.727 | 37,62 | ||||
| 2026-02-11 | 13F | Franklin Resources Inc | 69.436 | 27,14 | 1.000 | 71,06 | ||||
| 2026-01-22 | 13F | Accordant Advisory Group Inc | 189.821 | -0,11 | 2.728 | 33,81 | ||||
| 2026-02-17 | 13F | Cetera Investment Advisers | 12.670 | 183 | ||||||
| 2026-02-11 | 13F | Janney Montgomery Scott LLC | 24.860 | 2,37 | 0 | |||||
| 2026-02-12 | 13F | Verbena Value LP | 1.611.204 | 23.153 | ||||||
| 2026-01-29 | 13F | UMA Financial Services, Inc. | 42 | 1 | ||||||
| 2026-02-17 | 13F | DZ BANK AG Deutsche Zentral Genossenschafts Bank, Frankfurt am Main | 900.000 | 0,00 | 12.933 | 34,17 | ||||
| 2026-02-13 | 13F | American Century Companies Inc | 4.519.253 | -15,99 | 65.062 | 12,89 | ||||
| 2026-01-28 | 13F | Ruffer LLP | 3.255.131 | -44,87 | 46.997 | -25,71 | ||||
| 2026-02-17 | 13F/A | Intesa Sanpaolo S.p.a. | 10 | 0 | ||||||
| 2025-11-14 | 13F | AXA Investment Managers S.A. | 379.576 | 4.073 | ||||||
| 2026-02-17 | 13F | FIL Ltd | 2.500.000 | 35.991 | ||||||
| 2026-01-29 | 13F | Pictet Asset Management Holding SA | 37.762 | 12,91 | 544 | 51,96 | ||||
| 2026-02-13 | 13F | Neuberger Berman Group LLC | 166.699 | -2,65 | 2.403 | 31,03 | ||||
| 2025-11-07 | 13F | Shell Asset Management Co | 3.080 | -74,71 | 0 | |||||
| 2026-02-11 | 13F | Group One Trading, L.p. | 51.983 | -42,40 | 747 | -22,93 | ||||
| 2026-02-11 | 13F | Ameritas Investment Partners, Inc. | 106 | 2 | ||||||
| 2026-02-12 | 13F | Campbell & CO Investment Adviser LLC | 134.614 | 10,19 | 1.934 | 47,63 | ||||
| 2026-02-23 | 13F | Virtu Financial LLC | 21.734 | 0 | ||||||
| 2026-02-13 | 13F | Wells Fargo & Company/mn | 500 | 7 | ||||||
| 2026-01-21 | 13F | Stone House Investment Management, LLC | 100 | 1 | ||||||
| 2026-02-12 | 13F | Hrt Financial Lp | 26.357 | 0 | ||||||
| 2026-02-12 | 13F | CoreCommodity Management, LLC | 179.502 | -16,87 | 2.586 | 11,90 | ||||
| 2026-02-17 | 13F | Guggenheim Capital Llc | 144.554 | -6,19 | 2.077 | 25,65 | ||||
| 2026-02-17 | 13F | Two Sigma Investments, Lp | 853.748 | 41,52 | 12.268 | 89,53 | ||||
| 2026-02-13 | 13F | NewGen Asset Management Ltd | Call | 0 | -100,00 | 0 | ||||
| 2026-02-17 | 13F | Nokomis Capital, L.L.C. | 40.818 | 0,00 | 587 | 34,10 | ||||
| 2026-02-10 | 13F | Hillsdale Investment Management Inc. | 3.513.875 | 62,89 | 50.678 | 119,33 | ||||
| 2026-01-12 | 13F | CVA Family Office, LLC | 198 | 0,00 | 3 | 0,00 | ||||
| 2026-02-17 | 13F | PDT Partners, LLC | 0 | -100,00 | 0 | |||||
| 2026-02-13 | 13F | Kestra Advisory Services, LLC | 8.000 | 115 | ||||||
| 2026-02-13 | 13F | Marshall Wace, Llp | 517.778 | 7.440 | ||||||
| 2026-02-17 | 13F | Ameriprise Financial Inc | 13.519 | -22,88 | 194 | 3,19 | ||||
| 2026-02-02 | 13F | CM Management, LLC | 200.000 | 0,00 | 2.874 | 33,92 | ||||
| 2025-11-14 | 13F | Axa S.a. | 0 | -100,00 | 0 | |||||
| 2026-02-11 | 13F | Jpmorgan Chase & Co | 756.438 | -44,67 | 10.870 | -25,90 | ||||
| 2026-02-17 | 13F | Quadrature Capital Ltd | 576.121 | -37,16 | 8.304 | -15,52 | ||||
| 2025-11-19 | 13F | Caitong International Asset Management Co., Ltd | 0 | -100,00 | 0 | |||||
| 2026-02-17 | 13F | Two Sigma Advisers, Lp | 692.435 | -18,87 | 9.950 | 8,65 | ||||
| 2026-01-23 | 13F | Farther Finance Advisors, LLC | 4.010 | -5,82 | 58 | 26,67 | ||||
| 2026-01-21 | 13F | Towarzystwo Funduszy Inwestycyjnych Allianz Polska S.A. | 94.100 | 99,79 | 1.366 | 170,83 | ||||
| 2026-01-29 | 13F | UBS Group AG | 1.972.289 | -21,55 | 28.342 | 5,07 | ||||
| 2026-02-10 | 13F | Godfrey Financial Associates, Inc. | 54 | 1 | ||||||
| 2026-02-10 | 13F | Bnp Paribas | 0 | -100,00 | 0 | -100,00 | ||||
| 2026-02-13 | 13F | Police & Firemen's Retirement System of New Jersey | 74.198 | 0,00 | 1.070 | 34,47 | ||||
| 2026-01-29 | 13F | Vanguard Group Inc | 8.351.887 | 0,16 | 120.242 | 34,60 | ||||
| 2026-02-17 | 13F | Polar Asset Management Partners Inc. | 200.000 | 5,26 | 2.880 | 41,52 | ||||
| 2026-02-13 | 13F | Y-Intercept (Hong Kong) Ltd | 78.076 | -71,90 | 1.122 | -62,38 | ||||
| 2026-02-13 | 13F | National Bank Of Canada /fi/ | 1.034.847 | 120,27 | 14.874 | 201,58 | ||||
| 2026-02-17 | 13F | Toronto Dominion Bank | Call | 3.000 | -40,00 | 43 | -18,87 | |||
| 2026-01-28 | 13F | Eagle Global Advisors Llc | 12.601 | 181 | ||||||
| 2026-02-12 | 13F | Jane Street Group, Llc | Call | 0 | -100,00 | 0 | -100,00 | |||
| 2026-02-17 | 13F | Schonfeld Strategic Advisors LLC | 12.170 | -85,48 | 175 | -80,65 | ||||
| 2026-02-11 | 13F | Heartland Advisors Inc | 2.201.450 | -8,26 | 31.635 | 22,86 | ||||
| 2025-11-13 | 13F | NewGen Equity Long/Short Fund | Call | 600.000 | 7.031 | |||||
| 2026-02-17 | 13F | Alliancebernstein L.p. | 215.589 | -27,70 | 3.098 | -3,16 | ||||
| 2026-02-10 | 13F | CIBC World Markets Inc. | Put | 0 | -100,00 | 0 | -100,00 | |||
| 2026-02-13 | 13F | Bridgewater Associates, LP | 0 | -100,00 | 0 | |||||
| 2026-02-03 | 13F | Winch Advisory Services, LLC | 19 | 0,00 | 0 | |||||
| 2026-02-02 | 13F | PKO Investment Management Joint-Stock Co | 0 | -100,00 | 0 | |||||
| 2025-09-29 | NP | GOEX - Global X Gold Explorers ETF This fund is a listed as child fund of Mirae Asset Global Investments Co., Ltd. and if that institution has disclosed ownership in this security, then these positions will not be double counted when calculating total shares and total value | 138.823 | -3,56 | 947 | -1,56 | ||||
| 2026-02-09 | 13F | Waratah Capital Advisors Ltd. | 3.703.468 | -46,75 | 53.219 | -28,68 | ||||
| 2026-02-17 | 13F | Amundi | 1.751.157 | 11,92 | 25.178 | 38,55 | ||||
| 2026-01-28 | 13F | U S Global Investors Inc | 721.921 | 10.381 | ||||||
| 2026-02-17 | 13F | Canada Pension Plan Investment Board | 571.400 | 0,00 | 8.226 | 34,41 | ||||
| 2026-02-13 | 13F | BRITISH COLUMBIA INVESTMENT MANAGEMENT Corp | 107.137 | -9,59 | 1.542 | 21,51 | ||||
| 2025-11-13 | 13F | Diametric Capital, LP | 0 | -100,00 | 0 | |||||
| 2026-02-10 | 13F | Bnp Paribas Arbitrage, Sa | 540.483 | 183,65 | 7.767 | 279,94 | ||||
| 2026-02-17 | 13F | Toronto Dominion Bank | 714.399 | 22,69 | 10.285 | 64,93 | ||||
| 2025-09-29 | NP | PDN - Invesco FTSE RAFI Developed Markets ex-U.S. Small-Mid ETF This fund is a listed as child fund of Invesco Ltd. and if that institution has disclosed ownership in this security, then these positions will not be double counted when calculating total shares and total value | 59.793 | 0,00 | 408 | 2,01 | ||||
| 2026-02-17 | 13F | Toronto Dominion Bank | Put | 1.000 | -72,97 | 14 | -64,10 | |||
| 2026-01-12 | 13F | Edge Wealth Management LLC | 10.200 | 0,00 | 147 | 33,94 | ||||
| 2026-02-10 | 13F | CIBC Asset Management Inc | 188.835 | -6,25 | 2.720 | 26,22 | ||||
| 2026-02-13 | 13F | Stifel Financial Corp | 254.984 | -6,38 | 3.664 | 25,39 | ||||
| 2026-02-17 | 13F | Man Group plc | 790.616 | -65,48 | 11.396 | -53,56 | ||||
| 2026-02-10 | 13F | PCJ Investment Counsel Ltd. | 145.980 | -2,37 | 2.102 | 31,23 | ||||
| 2026-02-17 | 13F | Citadel Advisors Llc | Put | 43.200 | -1,37 | 621 | 32,20 | |||
| 2026-02-17 | 13F | Citadel Advisors Llc | Call | 22.200 | -69,25 | 319 | -58,79 | |||
| 2025-11-14 | 13F | Point72 (DIFC) Ltd | 5.500 | 59 | ||||||
| 2026-02-17 | 13F | PharVision Advisers, LLC | 13.410 | 193 | ||||||
| 2026-02-10 | 13F | CIBC World Markets Inc. | 93.828 | -76,83 | 1.351 | -68,84 | ||||
| 2026-02-17 | 13F | Citadel Advisors Llc | 568.299 | 66,48 | 8.166 | 122,99 | ||||
| 2026-02-17 | 13F | Tower Research Capital LLC (TRC) | 3.739 | -0,37 | 54 | 32,50 | ||||
| 2026-02-17 | 13F | Stansberry Asset Management, Llc | 110.750 | 24,15 | 1.597 | 66,95 | ||||
| 2026-02-12 | 13F | BRYN MAWR TRUST Co | 14.000 | 0,00 | 201 | 34,00 | ||||
| 2026-02-17 | 13F | Susquehanna International Group, Llp | 134.169 | -41,88 | 1.928 | -22,13 | ||||
| 2026-02-17 | 13F | Susquehanna International Group, Llp | Put | 83.700 | 186,64 | 1.203 | 284,03 | |||
| 2026-02-06 | 13F | IFP Advisors, Inc | 609 | -24,16 | 9 | 0,00 | ||||
| 2026-02-17 | 13F | New Vernon Capital Holdings II LLC | 841 | 17 | ||||||
| 2025-10-23 | 13F | SG Americas Securities, LLC | 0 | -100,00 | 0 | |||||
| 2026-02-17 | 13F | Balyasny Asset Management Llc | 0 | -100,00 | 0 | -100,00 | ||||
| 2026-02-17 | 13F | Susquehanna International Group, Llp | Call | 200.300 | 25,34 | 2.878 | 67,91 | |||
| 2026-02-11 | 13F | Hilton Head Capital Partners, LLC | 148 | 2 | ||||||
| 2026-02-17 | 13F | XTX Topco Ltd | 77.301 | 291,75 | 1.111 | 426,07 | ||||
| 2026-02-13 | 13F | Quarry LP | 906 | 13 | ||||||
| 2026-02-13 | 13F | Extract Advisors LLC | 605.600 | 8.717 | ||||||
| 2026-01-22 | 13F | Massachusetts Financial Services Co /ma/ | 18.367 | -13,50 | 264 | 15,86 | ||||
| 2025-11-10 | 13F | Counterpoint Mutual Funds LLC | 0 | -100,00 | 0 | |||||
| 2026-02-12 | 13F | Renaissance Technologies Llc | 548.700 | -30,28 | 7.885 | -6,63 | ||||
| 2026-02-13 | 13F | Aigen Investment Management, Lp | 0 | -100,00 | 0 | |||||
| 2026-02-02 | 13F | Danske Bank A/s | 2 | -99,36 | 0 | -100,00 | ||||
| 2026-02-17 | 13F | Aquatic Capital Management LLC | 83.897 | 53,65 | 1.206 | 105,98 | ||||
| 2026-02-13 | 13F | Pale Fire Capital SE | 591.222 | -74,69 | 8.496 | -66,11 | ||||
| 2026-02-13 | 13F | BNP Paribas Asset Management Holding S.A. | 347.827 | 7 | ||||||
| 2026-02-17 | 13F | Keebeck Alpha, LP | 0 | -100,00 | 0 | |||||
| 2026-02-11 | 13F | O'shaughnessy Asset Management, Llc | 495.171 | -9,86 | 7.116 | 20,73 | ||||
| 2025-11-13 | 13F | Aristides Capital LLC | 0 | -100,00 | 0 | |||||
| 2026-02-13 | 13F | SRS Capital Advisors, Inc. | 250 | 0,00 | 4 | 50,00 | ||||
| 2025-11-14 | 13F | Point72 Asia (Singapore) Pte. Ltd. | 20.560 | 221 | ||||||
| 2026-02-17 | 13F | Edmond De Rothschild Holding S.a. | 600.000 | -62,50 | 8.659 | -49,47 | ||||
| 2026-02-06 | 13F | Leonteq Securities AG | 5.000 | -58,33 | 99 | -45,25 | ||||
| 2026-02-17 | 13F | Voleon Capital Management Lp | 0 | -100,00 | 0 | |||||
| 2026-02-11 | 13F | LPL Financial LLC | 46.265 | 205,62 | 665 | 309,88 | ||||
| 2026-02-05 | 13F | Allworth Financial LP | 9 | 0,00 | 0 | |||||
| 2026-02-13 | 13F | Great West Life Assurance Co /can/ | 33.805 | -53,43 | 0 | |||||
| 2026-02-13 | 13F | Virtus ETF Advisers LLC | 287.810 | 0,00 | 5.115 | 32,93 | ||||
| 2026-02-17 | 13F | Hartree Partners, LP | 0 | -100,00 | 0 | |||||
| 2025-11-14 | 13F | Wolverine Trading, Llc | 27.454 | 35,69 | 286 | 100,70 | ||||
| 2026-02-17 | 13F | Russell Investments Group, Ltd. | 692.309 | -7,42 | 9.981 | 24,65 | ||||
| 2025-11-14 | 13F | Wolverine Trading, Llc | Call | 40.200 | 52,27 | 418 | 124,73 | |||
| 2026-02-10 | 13F | State of Wyoming | 5.122 | -38,70 | 74 | -17,98 | ||||
| 2025-11-14 | 13F | Wolverine Trading, Llc | Put | 19.300 | -24,31 | 201 | 11,11 | |||
| 2026-02-17 | 13F | Lazard Asset Management Llc | 150.622 | -63,41 | 2.168 | -50,82 | ||||
| 2026-02-13 | 13F | Hatch Cove Capital, Llc | 1.252.700 | 18.001 |