Statistik Dasar
| Pemilik Institusi | 211 total, 211 long only, 0 short only, 0 long/short - change of 4,46% MRQ |
| Alokasi Portofolio Rata-rata | 0.5247 % - change of 6,17% MRQ |
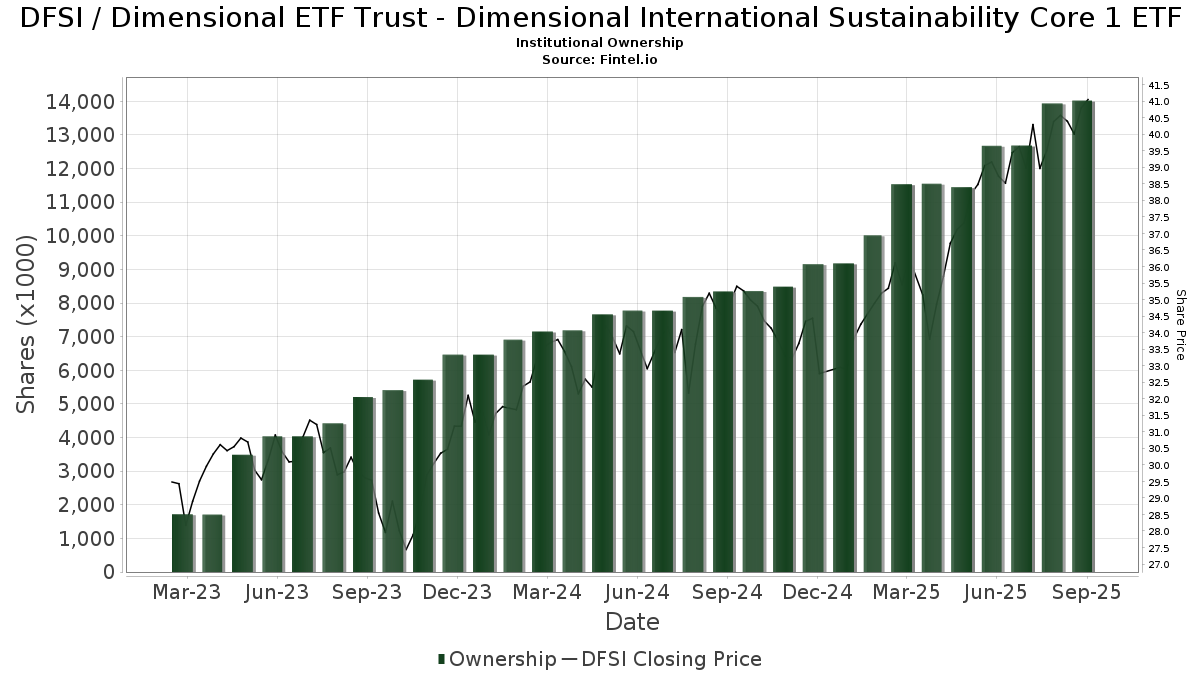
| Saham Institusi (Long) | 15.399.232 (ex 13D/G) - change of 0,48MM shares 3,20% MRQ |
| Nilai Institusi (Long) | $ 646.254 USD ($1000) |
Kepemilikan Institusi dan Pemegang Saham
Dimensional ETF Trust - Dimensional International Sustainability Core 1 ETF (US:DFSI) punya 211 pemilik institusi dan pemegang saham yang telah mengajukan formulir 13D/G atau 13F ke Securities Exchange Commission (SEC). Institusi-institusi ini memiliki total 15,399,232 saham. Pemegang saham terbesar termasuk Colony Group, LLC, Maseco Llp, Awm Capital, Llc, Quantum Financial Advisors, LLC, Francis Financial, Inc., Pathstone Holdings, LLC, Abacus Wealth Partners, LLC, LongView Asset Management LLC, Five Oceans Advisors, and Citrine Capital LLC .
Dimensional ETF Trust - Dimensional International Sustainability Core 1 ETF (ARCA:DFSI) struktur kepemilikan institusi menunjukkan posisi saat ini di perusahaan menurut institusi dan dana, serta perubahan terkini dalam ukuran posisi. Pemegang saham utama dapat mencakup investor individu, reksa dana, hedge funds, atau institusi. Jadwal 13D menunjukkan bahwa investor memegang lebih dari 5% saham perusahaan dan bermaksud untuk secara aktif melakukan perubahan dalam strategi bisnis. Jadwal 13G menunjukkan investasi pasif lebih dari 5%.
The share price as of March 17, 2026 is 43,18 / share. Previously, on March 18, 2025, the share price was 36,17 / share. This represents an increase of 19,38% over that period.
Skor Sentimen Dana
Skor Sentimen Dana (Ownership Accumulation Score) menemukan saham-saham yang paling banyak dibeli oleh dana. Hal ini merupakan hasil dari model kuantitatif multifaktor yang canggih yang mengidentifikasi perusahaan-perusahaan dengan tingkat akumulasi institusi tertinggi. Model penilaian menggunakan kombinasi total peningkatan pemilik yang diungkapkan, perubahan alokasi portofolio pada pemilik tersebut, dan metrik lainnya. Angka tersebut berkisar dari 0 hingga 100, dengan angka yang lebih tinggi menunjukkan tingkat akumulasi yang lebih tinggi terhadap rekan-rekannya, dan 50 adalah rata-ratanya.
Frekuensi Pembaruan: Harian
Lihat Penjelajah Kepemilikan, yang menyediakan daftar perusahaan dengan peringkat tertinggi.
AI+ Ask Fintel’s AI assistant about Dimensional ETF Trust - Dimensional International Sustainability Core 1 ETF.
Select a question to share a public post with an AI-crafted answer.
Thinking of good questions…
Rasio Put/Call Institusi
Selain melaporkan masalah ekuitas dan utang standar, institusi dengan lebih dari 100MM aset yang dikelola juga harus mengungkapkan kepemilikan opsi put dan call mereka. Karena opsi put umumnya mengindikasikan sentimen negatif, dan opsi call mengindikasikan sentimen positif, kita dapat memahami sentimen institusional secara keseluruhan dengan memplot rasio opsi put terhadap opsi call. Grafik di sebelah kanan menggambarkan rasio put/call historis untuk instrumen ini.
Penggunaan Rasio Put/Call sebagai indikator sentimen investor mengatasi salah satu kelemahan utama dalam menggunakan total kepemilikan institusional, yaitu sejumlah besar aset yang dikelola diinvestasikan secara pasif untuk melacak indeks. Dana yang dikelola secara pasif biasanya tidak membeli opsi sehingga indikator rasio put/call lebih dekat melacak sentimen dana yang dikelola secara aktif.
Pengajuan 13F dan NPORT
Detail pengajuan 13F gratis. Detail pengajuan NP memerlukan keanggotaan premium. Baris hijau menunjukkan posisi baru. Baris merah menunjukkan posisi yang sudah ditutup. Klik tautannya ikon untuk melihat riwayat transaksi lengkap.
Upgrade
untuk membuka data premium dan mengekspor ke Excel ![]() .
.
| Tanggal Berkas | Sumber | Investor | Jenis | Harga Rata-rata (Perkiraan) |
Saham | Δ Saham (%) |
Dilaporkan Nilai ($1000) |
Δ Nilai (%) |
Alokasi Portofolio (%) |
|
|---|---|---|---|---|---|---|---|---|---|---|
| 2026-01-16 | 13F | Perigon Wealth Management, LLC | 110.015 | 6,39 | 4.714 | 11,31 | ||||
| 2026-02-11 | 13F | Cerity Partners LLC | 43.412 | -3,90 | 1.900 | 2,15 | ||||
| 2026-01-29 | 13F | Rockwood Wealth Management, LLC | 4.700 | 201 | ||||||
| 2026-02-04 | 13F | Pure Financial Advisors, Inc. | 154.488 | 22,01 | 6.619 | 27,66 | ||||
| 2026-01-30 | 13F | Samalin Investment Counsel, LLC | 14.708 | 6,52 | 630 | 11,50 | ||||
| 2026-01-16 | 13F | Heck Capital Advisors, LLC | 5.896 | 253 | ||||||
| 2026-01-09 | 13F | Graves-Light Private Wealth Management, Inc. | 5.996 | 0,00 | 257 | 4,49 | ||||
| 2026-02-17 | 13F | Hill Investment Group Partners, LLC | 11.306 | 131,06 | 484 | 142,00 | ||||
| 2026-01-15 | 13F | BetterWealth, LLC | 26.606 | -7,01 | 1.140 | -2,73 | ||||
| 2026-01-27 | 13F | Mills Wealth Advisors LLC | 6.886 | 3,22 | 295 | 8,06 | ||||
| 2026-02-03 | 13F | Orion Capital Management LLC | 6.961 | 1,00 | 298 | 5,67 | ||||
| 2026-02-06 | 13F | Morling Financial Advisors, LLC | 11.087 | 1,91 | 475 | 6,74 | ||||
| 2026-01-28 | 13F | First Financial Group Corp | 11.671 | 4,48 | 500 | 9,41 | ||||
| 2026-02-17 | 13F | Awm Capital, Llc | 865.288 | 4,95 | 37.073 | 9,81 | ||||
| 2026-02-10 | 13F | McGrath & Associates, Inc. | 11.212 | -8,84 | 480 | -4,57 | ||||
| 2026-01-16 | 13F | DiNuzzo Private Wealth, Inc. | 27.275 | -6,61 | 1.169 | -0,76 | ||||
| 2026-01-16 | 13F | Keystone Financial Group, Inc. | 695 | 16,42 | 30 | 20,83 | ||||
| 2026-02-06 | 13F | HighTower Advisors, LLC | 16.573 | 6,04 | 710 | 10,94 | ||||
| 2026-02-13 | 13F | Aptus Capital Advisors, LLC | 193 | 0,00 | 8 | 14,29 | ||||
| 2026-01-05 | 13F | Garrett Investment Advisors LLC | 22.690 | 5,89 | 972 | 10,83 | ||||
| 2026-01-14 | 13F | Allodium Investment Consultants, LLC | 191.922 | 1,97 | 8.223 | 6,68 | ||||
| 2026-01-20 | 13F | Revolve Wealth Partners, LLC | 66.032 | 3,63 | 2.829 | 8,43 | ||||
| 2026-02-12 | 13F | Bank Of Montreal /can/ | 12.575 | -2,70 | 539 | 1,70 | ||||
| 2026-02-02 | 13F | Integrity Wealth Solutions LLC | 5.645 | -1,86 | 242 | 2,55 | ||||
| 2026-02-13 | 13F | Mml Investors Services, Llc | 65.596 | 23,49 | 2.810 | 29,20 | ||||
| 2026-02-09 | 13F | Hartland & Co., LLC | 2.878 | 0,00 | 123 | 5,13 | ||||
| 2026-02-17 | 13F | Citadel Advisors Llc | 131.333 | 80,11 | 5.627 | 88,41 | ||||
| 2026-02-06 | 13F | Fort Vancouver Investment Management, LLC | 984 | 7,66 | 42 | 13,51 | ||||
| 2026-01-28 | 13F | Trademark Financial Management, LLC | 17.943 | 769 | ||||||
| 2025-12-16 | 13F | Keel Point, LLC | 0 | -100,00 | 0 | -100,00 | ||||
| 2026-01-21 | 13F | ProCore Advisors, LLC | 39.786 | 1.705 | ||||||
| 2026-02-11 | 13F | United Wealth Management, LLC | 14.898 | 0,00 | 638 | 4,59 | ||||
| 2026-02-11 | 13F | LPL Financial LLC | 39.057 | 10,96 | 1.673 | 16,10 | ||||
| 2026-02-03 | 13F | Sequoia Financial Advisors, LLC | 83.154 | -10,56 | 3.563 | -6,44 | ||||
| 2026-02-10 | 13F/A | Northwestern Mutual Wealth Management Co | 299 | 13 | ||||||
| 2026-02-13 | 13F | Stifel Financial Corp | 5.931 | 3,65 | 254 | 8,55 | ||||
| 2026-02-17 | 13F | Warren Averett Asset Management, LLC | 12.624 | 0,00 | 541 | 4,65 | ||||
| 2026-02-02 | 13F | Heritage Financial Services, LLC | 178.466 | 3,85 | 7.646 | 8,65 | ||||
| 2026-01-29 | 13F | UBS Group AG | 0 | -100,00 | 0 | |||||
| 2026-01-20 | 13F | New Capital Management LP | 181.948 | -2,51 | 7.796 | 2,00 | ||||
| 2026-02-12 | 13F | Betterment LLC | 113.552 | 19,43 | 5 | 33,33 | ||||
| 2026-01-26 | 13F | JNBA Financial Advisors | 922 | 40 | ||||||
| 2026-02-06 | 13F | Geometric Wealth Advisors | 9.871 | 0,52 | 423 | 4,98 | ||||
| 2026-02-06 | 13F | IFP Advisors, Inc | 785 | 14,26 | 34 | 17,86 | ||||
| 2026-02-06 | 13F | Larson Financial Group LLC | 2.542 | 109 | ||||||
| 2026-02-02 | 13F | Miracle Mile Advisors, LLC | 20.219 | 156,42 | 866 | 168,94 | ||||
| 2026-02-11 | 13F | Prime Buchholz LLC | 6.814 | 0,00 | 292 | 4,30 | ||||
| 2026-02-17 | 13F | Susquehanna International Group, Llp | 0 | -100,00 | 0 | |||||
| 2026-01-16 | 13F | Red Lighthouse Investment Management, Llc | 3.444 | 5,22 | 148 | 9,70 | ||||
| 2026-02-09 | 13F | Syverson Strege & Co | 43.714 | -4,84 | 1.873 | -0,48 | ||||
| 2026-01-07 | 13F | Henrickson Nauta Wealth Advisors, Inc. | 91.744 | 105,32 | 4.020 | 119,74 | ||||
| 2026-02-13 | 13F | North Ridge Wealth Advisors, Inc. | 17.689 | 25,57 | 758 | 31,42 | ||||
| 2026-01-15 | 13F | Foundation Wealth Management, LLC\PA | 13.857 | 0,41 | 594 | 4,96 | ||||
| 2026-02-05 | 13F | Mission Wealth Management, Lp | 4.958 | 212 | ||||||
| 2026-01-26 | 13F | XY Planning Network, Inc. | 13.379 | 121,32 | 573 | 140,76 | ||||
| 2026-02-06 | 13F | Ruedi Wealth Management, Inc. | 7.591 | 3,04 | 325 | 7,97 | ||||
| 2026-02-27 | 13F | Strategic Investment Solutions, Inc. /IL | 102 | 0,99 | 4 | 0,00 | ||||
| 2026-02-13 | 13F | Clarity Asset Management, Inc. | 871 | 37 | ||||||
| 2026-02-13 | 13F | Bay Colony Advisory Group, Inc d/b/a Bay Colony Advisors | 6.350 | -4,51 | 272 | 0,00 | ||||
| 2026-02-10 | 13F | Savant Capital, LLC | 94.938 | 27,52 | 4.068 | 33,43 | ||||
| 2026-01-21 | 13F | Sensenig Capital Advisors, Inc | 18.053 | 773 | ||||||
| 2026-01-26 | 13F | Quarry Hill Advisors, Llc | 121.563 | 15,98 | 5.208 | 21,34 | ||||
| 2026-02-19 | 13F | CI Private Wealth, LLC | 92.157 | 3,74 | 3.948 | 8,55 | ||||
| 2026-01-16 | 13F | Five Oceans Advisors | 390.299 | 12,66 | 16.722 | 17,88 | ||||
| 2026-01-28 | 13F | Financial Plan, Inc. | 9.634 | 413 | ||||||
| 2026-01-27 | 13F | Brighton Jones Llc | 0 | -100,00 | 0 | |||||
| 2026-02-05 | 13F | Allworth Financial LP | 7.133 | 0,30 | 306 | 4,81 | ||||
| 2026-02-17 | 13F | Cahill Financial Advisors Inc | 30.836 | -3,08 | 1.321 | 1,46 | ||||
| 2026-02-10 | 13F | Envestnet Asset Management Inc | 0 | -100,00 | 0 | |||||
| 2026-02-03 | 13F | Coston, McIsaac & Partners | 3.401 | 0,24 | 0 | |||||
| 2026-02-17 | 13F | Momentous Wealth Management, Inc. | 75.759 | -0,66 | 3.246 | 3,91 | ||||
| 2026-01-22 | 13F | Hill Island Financial Llc | 198.493 | 3,22 | 8.504 | 8,00 | ||||
| 2026-02-13 | 13F | Burton Enright Welch | 11.814 | 506 | ||||||
| 2026-02-17 | 13F | Mercer Global Advisors Inc /adv | 123.280 | 35,97 | 5.282 | 42,27 | ||||
| 2026-01-28 | 13F | Chicago Partners Investment Group LLC | 25.623 | 24,46 | 1.145 | 33,45 | ||||
| 2026-02-11 | 13F | Curio Wealth, Llc | 2.855 | 1,75 | 123 | 7,89 | ||||
| 2025-11-20 | 13F | First Affirmative Financial Network | 0 | -100,00 | 0 | |||||
| 2026-01-08 | 13F | Wealth Enhancement Advisory Services, Llc | 172.077 | 5,60 | 7.539 | 11,95 | ||||
| 2026-02-18 | 13F | EP Wealth Advisors, Inc. | 5.576 | -60,67 | 239 | -57,35 | ||||
| 2026-02-17 | 13F | Advisor Group Holdings, Inc. | 9.959 | 8,12 | 427 | 13,30 | ||||
| 2026-01-12 | 13F | Archer Investment Management, LLC | 61.817 | -24,22 | 2.649 | -20,72 | ||||
| 2026-01-06 | 13F | Freedom Financial Partners LLC | 11.876 | 0,52 | 509 | 5,18 | ||||
| 2026-01-12 | 13F | Quantum Financial Advisors, LLC | 854.904 | -0,03 | 36.628 | 4,59 | ||||
| 2026-02-12 | 13F | von Borstel & Associates, Inc. | 0 | -100,00 | 0 | |||||
| 2026-01-26 | 13F | Asset Dedication, LLC | 109.271 | -0,70 | 4.682 | 3,88 | ||||
| 2026-02-13 | 13F | Pathstone Holdings, LLC | 725.730 | 46,22 | 31.094 | 52,99 | ||||
| 2026-01-12 | 13F | Foster Group, Inc. | 50.606 | 6,24 | 2.168 | 11,18 | ||||
| 2026-02-10 | 13F | Bridge Generations Wealth Management Llc | 8.754 | -20,24 | 375 | -16,48 | ||||
| 2026-01-12 | 13F | Cordant, Inc. | 20.894 | 0,23 | 895 | 4,92 | ||||
| 2026-01-09 | 13F | Zrc Wealth Management, Llc | 10.988 | 0,52 | 471 | 5,15 | ||||
| 2026-02-06 | 13F | Delap Wealth Advisory, Llc | 10.255 | 0,00 | 439 | 4,03 | ||||
| 2026-01-29 | 13F | D.a. Davidson & Co. | 6.715 | 25,33 | 288 | 31,05 | ||||
| 2026-01-14 | 13F | Clarius Group, LLC | 7.178 | 5,36 | 308 | 10,43 | ||||
| 2026-01-29 | 13F | UMA Financial Services, Inc. | 9.239 | 0,00 | 396 | 4,50 | ||||
| 2026-01-27 | 13F | Forum Financial Management, LP | 285.878 | -0,37 | 12.248 | 4,24 | ||||
| 2026-02-11 | 13F | Fund Evaluation Group, LLC | 0 | -100,00 | 0 | |||||
| 2026-01-20 | 13F | AdvisorNet Financial, Inc | 15.140 | 0,99 | 649 | 5,71 | ||||
| 2026-01-20 | 13F | Pine Harbor Wealth Management, LLC | 6.364 | 0,00 | 273 | 4,62 | ||||
| 2026-01-21 | 13F | Signature Resources Capital Management, LLC | 4.765 | 0,87 | 204 | 5,70 | ||||
| 2026-01-30 | 13F | Simplicity Wealth,LLC | 82.970 | 260,60 | 3.555 | 277,28 | ||||
| 2026-02-17 | 13F | Wealth Management Strategies, Inc. | 25.015 | 6,72 | 1.072 | 11,68 | ||||
| 2026-02-10 | 13F | Garde Capital, Inc. | 85.988 | 2,54 | 3.684 | 7,28 | ||||
| 2026-01-15 | 13F | My Personal CFO, LLC | 0 | -100,00 | 0 | |||||
| 2026-02-10 | 13F | Goldman Sachs Group Inc | 0 | -100,00 | 0 | |||||
| 2026-02-12 | 13F | Wealthspire Advisors, LLC | 59.374 | -0,26 | 2.544 | 4,35 | ||||
| 2026-01-28 | 13F | EnRich Financial Partners LLC | 11.915 | -0,31 | 510 | 4,29 | ||||
| 2026-02-17 | 13F | Bank Of America Corp /de/ | 522 | 22 | ||||||
| 2026-02-13 | 13F | Pinney & Scofield, Inc. | 1.113 | 48 | ||||||
| 2026-01-30 | 13F | Towneley Capital Management, Inc / DE | 4.974 | 213 | ||||||
| 2026-01-15 | 13F | PFG Private Wealth Management, LLC | 0 | -100,00 | 0 | |||||
| 2026-02-04 | 13F | LRI Investments, LLC | 3.077 | 0,00 | 132 | 3,97 | ||||
| 2026-02-02 | 13F | TCI Wealth Advisors, Inc. | 108.525 | 16,18 | 4.650 | 21,54 | ||||
| 2026-02-10 | 13F | Cherry Tree Wealth Management, LLC | 713 | 0,00 | 31 | 3,45 | ||||
| 2026-02-10 | 13F | Root Financial Partners, LLC | 17.386 | 50,25 | 745 | 57,29 | ||||
| 2026-01-08 | 13F | True Wealth Design, LLC | 7.028 | -17,02 | 301 | -13,01 | ||||
| 2026-02-12 | 13F | Penobscot Wealth Management | 7.749 | 1,76 | 332 | 6,75 | ||||
| 2026-02-02 | 13F | Your Advocates Ltd., LLP | 1.460 | 63 | ||||||
| 2026-02-05 | 13F | Thrivent Financial For Lutherans | 147.974 | 6 | ||||||
| 2026-02-13 | 13F | Brown Advisory Inc | 8.256 | 33,25 | 354 | 39,53 | ||||
| 2026-02-17 | 13F | Envision Financial Planning, LLC | 8.671 | -4,18 | 371 | 0,27 | ||||
| 2026-01-23 | 13F | Investment Advisory Group, LLC | 12.274 | 0,00 | 526 | 4,58 | ||||
| 2026-02-04 | 13F | Schubert & Co | 24.904 | 0,00 | 1.067 | 4,71 | ||||
| 2026-01-16 | 13F | RHS Financial, LLC | 5.887 | 0,34 | 252 | 5,00 | ||||
| 2026-02-11 | 13F | Francis Financial, Inc. | 741.881 | 5,24 | 31.786 | 10,11 | ||||
| 2026-02-12 | 13F | Jane Street Group, Llc | 28.004 | -86,38 | 1.200 | -85,76 | ||||
| 2026-01-16 | 13F | Wealth Advisors Northwest LLC | 12.457 | 13,22 | 534 | 18,44 | ||||
| 2026-02-11 | 13F | Babb Wealth Advisors LLC | 24.341 | 20,33 | 1.043 | 25,85 | ||||
| 2026-02-10 | 13F | Old Peak Finance LLC | 9.525 | 408 | ||||||
| 2026-02-13 | 13F | Flow Traders U.s. Llc | 13.149 | -84,50 | 1 | -100,00 | ||||
| 2026-01-29 | 13F | Retirement Solution Inc. | 355.427 | -1,59 | 15.228 | 2,96 | ||||
| 2026-01-14 | 13F | Family Wealth Partners, Llc | 7.536 | 6,08 | 323 | 11,03 | ||||
| 2026-02-11 | 13F | Jpmorgan Chase & Co | 2.116 | 0,52 | 91 | 4,65 | ||||
| 2026-01-29 | 13F | Dunhill Financial, LLC | 820 | 35 | ||||||
| 2026-02-17 | 13F | Private Advisor Group, LLC | 12.732 | 1,15 | 546 | 5,83 | ||||
| 2026-02-12 | 13F | Timmons Wealth Management, LLC | 898 | 38 | ||||||
| 2026-01-29 | 13F | Equita Financial Network, Inc. | 49.221 | 12,98 | 2.109 | 18,16 | ||||
| 2026-02-13 | 13F | Parkside Financial Bank & Trust | 39.277 | -5,10 | 1.683 | -0,71 | ||||
| 2026-02-09 | 13F | LongView Asset Management LLC | 423.719 | -3,81 | 18.154 | 0,64 | ||||
| 2025-11-14 | 13F | RW Investment Management LLC | 81.910 | 0,53 | 3.354 | 4,45 | ||||
| 2026-01-21 | 13F | Apella Capital, LLC | 212.458 | 10,79 | 9.103 | 15,03 | ||||
| 2026-02-10 | 13F | Greenspring Advisors, LLC | 211.590 | 3,51 | 9.066 | 8,30 | ||||
| 2026-02-19 | 13F | Professional Financial Solutions Llc /adv | 16.859 | 722 | ||||||
| 2026-01-22 | 13F | Maseco Llp | 946.932 | 4,84 | 40.571 | 9,52 | ||||
| 2026-02-17 | 13F | Donalies Financial Planning, LLC | 102.636 | 4.397 | ||||||
| 2026-02-18 | 13F | Beacon Pointe Advisors, LLC | 119.350 | 2,04 | 5.114 | 6,77 | ||||
| 2026-02-13 | 13F | Balanced Rock Investment Advisor | 215.035 | 1,27 | 9.213 | 5,96 | ||||
| 2026-01-26 | 13F | Level Financial Advisors, Inc. | 31.549 | 5,23 | 1.352 | 10,11 | ||||
| 2026-02-02 | 13F | Triune Financial Partners, LLC | 109.734 | -1,55 | 4.906 | 7,49 | ||||
| 2026-01-14 | 13F | Jfs Wealth Advisors, Llc | 1.133 | 0,00 | 49 | 4,35 | ||||
| 2026-02-09 | 13F | Premier Financial Group | 33.109 | -0,26 | 1.420 | 4,41 | ||||
| 2026-02-02 | 13F | Planning Center, Inc. | 190.420 | -8,42 | 8.159 | -4,18 | ||||
| 2026-02-05 | 13F | Cardinal Point Capital Management, ULC | 74.795 | 3,24 | 3.205 | 8,46 | ||||
| 2026-01-15 | 13F | Frank, Rimerman Advisors LLC | 8.316 | 0,00 | 356 | 4,71 | ||||
| 2026-02-06 | 13F | Tortoise Investment Management, LLC | 0 | -100,00 | 0 | |||||
| 2026-02-13 | 13F | Smartleaf Asset Management LLC | 1.391 | 0,00 | 60 | 5,36 | ||||
| 2026-02-17 | 13F | Angeles Investment Advisors, LLC | 106.160 | 47,32 | 4.548 | 54,17 | ||||
| 2026-02-17 | 13F | Wealth Architects, LLC | 155.234 | 24,81 | 6.651 | 30,57 | ||||
| 2026-02-12 | 13F | Compass Capital Corp /ma/ /adv | 14.820 | 0,93 | 685 | 12,11 | ||||
| 2026-03-04 | 13F | Rehmann Capital Advisory Group | 12.408 | 0,81 | 532 | 5,36 | ||||
| 2026-02-12 | 13F | Commonwealth Equity Services, Llc | 47.678 | -11,85 | 2.043 | 102.000,00 | ||||
| 2026-02-13 | 13F | Kestra Advisory Services, LLC | 0 | -100,00 | 0 | |||||
| 2025-11-24 | 13F | CIBC Private Wealth Group, LLC | 0 | -100,00 | 0 | |||||
| 2026-01-26 | 13F | Tanager Wealth Management LLP | 9.782 | -22,70 | 419 | -19,11 | ||||
| 2026-01-23 | 13F | Creative Capital Management Investments LLC | 28.780 | 0,00 | 1.233 | 4,67 | ||||
| 2026-02-09 | 13F | Schwarz Dygos Wheeler Investment Advisors Llc | 18.454 | -10,86 | 791 | -6,73 | ||||
| 2026-01-27 | 13F | Vestia Personal Wealth Advisors | 5.341 | 236 | ||||||
| 2026-02-05 | 13F | Abacus Wealth Partners, LLC | 582.626 | -1,05 | 24.963 | 3,53 | ||||
| 2026-02-11 | 13F | Vermillion Wealth Management, Inc. | 11.771 | 0,52 | 504 | 5,22 | ||||
| 2026-01-15 | 13F | Monument Group Wealth Advisors, LLC | 6.634 | 0,00 | 284 | 4,80 | ||||
| 2026-01-14 | 13F | Accurate Wealth Management, LLC | 5.915 | 1,42 | 261 | 9,21 | ||||
| 2026-01-26 | 13F | Grand Wealth Management, Llc | 17.249 | -1,91 | 739 | 2,64 | ||||
| 2026-01-09 | 13F | Cambridge Financial Group, LLC | 46.692 | -17,25 | 1.695 | -26,67 | ||||
| 2026-02-13 | 13F | WPWealth LLP | 15.401 | -0,62 | 660 | 3,94 | ||||
| 2026-02-18 | 13F | GWM Advisors LLC | 22.697 | -4,87 | 972 | -0,51 | ||||
| 2026-02-02 | 13F | Acorn Creek Capital Llc | 6.554 | -1,46 | 281 | 2,94 | ||||
| 2026-02-06 | 13F | Addison Advisors LLC | 96.042 | 1,04 | 4.115 | 5,70 | ||||
| 2026-02-11 | 13F | Buckingham Strategic Partners | 131.428 | -16,76 | 5.631 | -13,67 | ||||
| 2026-01-21 | 13F | Modera Wealth Management, LLC | 20.344 | -0,46 | 872 | 4,19 | ||||
| 2026-01-28 | 13F | CAPROCK Group, Inc. | 10.868 | -4,96 | 466 | 1,09 | ||||
| 2026-02-11 | 13F | Truepoint, Inc. | 66.561 | -0,27 | 2.852 | 4,36 | ||||
| 2026-01-13 | 13F | Define Financial, Llc | 9.199 | -8,44 | 394 | -4,14 | ||||
| 2025-11-06 | 13F | Asset Planning Corporation | 7.400 | 0,01 | 303 | 4,12 | ||||
| 2025-11-14 | 13F | Old Mission Capital Llc | 0 | -100,00 | 0 | |||||
| 2026-02-17 | 13F | Hancock Whitney Corp | 15.774 | 0,00 | 676 | 4,65 | ||||
| 2026-02-09 | 13F | Morris Financial Concepts, Inc. | 5.133 | 0,00 | 220 | 4,29 | ||||
| 2026-02-11 | 13F | Petersen Hastings Wealth Advisors Inc. | 17.762 | 761 | ||||||
| 2026-01-26 | 13F | Sellwood Investment Partners LLC | 15.743 | 3,31 | 675 | 8,01 | ||||
| 2026-02-17 | 13F | Raymond James Financial Inc | 86.062 | 274,51 | 3.687 | 291,82 | ||||
| 2026-02-17 | 13F | Wheels Up Wealth, Inc. | 34.582 | 1.482 | ||||||
| 2026-01-14 | 13F | Meritas Wealth Management, LLC | 10.375 | 4,54 | 445 | 9,36 | ||||
| 2026-01-12 | 13F | Shira Ridge Wealth Management | 19.224 | -1,87 | 824 | 2,62 | ||||
| 2026-02-03 | 13F | Washington Trust Advisors, Inc. | 4.181 | 0,53 | 179 | 5,29 | ||||
| 2026-01-22 | 13F | Glass Jacobson Investment Advisors llc | 3.262 | 4,69 | 140 | 9,45 | ||||
| 2026-01-23 | 13F | Financial Connections Group, Inc. | 22.097 | 11,59 | 1 | |||||
| 2026-01-22 | 13F | Red Tortoise LLC | 6.206 | 0,00 | 266 | 4,33 | ||||
| 2026-01-26 | 13F | Trellis Wealth Advisors LLC | 47.954 | -0,04 | 2.055 | 4,58 | ||||
| 2026-02-13 | 13F | Resources Investment Advisors, LLC. | 112.314 | -1,50 | 4.812 | 3,06 | ||||
| 2026-02-04 | 13F | Nwam Llc | 33.640 | -5,07 | 1.441 | -0,69 | ||||
| 2026-02-17 | 13F | Cardiff Park Advisors, Llc | 7.095 | 57,84 | 304 | 64,67 | ||||
| 2026-01-12 | 13F | Fiduciary Financial Group, Llc | 28.765 | 15,63 | 1.232 | 21,02 | ||||
| 2026-02-10 | 13F | MB Generational Wealth, LLC | 37.228 | 6,23 | 1.595 | 11,15 | ||||
| 2026-02-13 | 13F | Colony Group, LLC | 1.166.911 | -1,22 | 49.996 | 3,35 | ||||
| 2026-01-23 | 13F | Farther Finance Advisors, LLC | 25.805 | -1,70 | 1.106 | 2,89 | ||||
| 2026-02-05 | 13F | Passive Capital Management, LLC. | 10.700 | 0,00 | 458 | 4,57 | ||||
| 2026-01-20 | 13F | Northland Capital Management LLC | 51.107 | 0,12 | 2.190 | 4,74 | ||||
| 2026-02-13 | 13F | C M Bidwell & Associates Ltd | 1.300 | 0,00 | 56 | 3,77 | ||||
| 2026-01-20 | 13F | Citrine Capital LLC | 357.330 | 2,81 | 15.310 | 7,57 | ||||
| 2026-02-12 | 13F | Altiora Financial Group, LLC | 0 | -100,00 | 0 | |||||
| 2026-02-11 | 13F | RAM Investment Partners, LLC | 121.930 | 3,24 | 5.224 | 8,02 | ||||
| 2026-02-13 | 13F | Morgan Stanley | 6.403 | 2.077,89 | 274 | 2.183,33 | ||||
| 2026-02-09 | 13F | Hutchinson Capital Management/ca | 45.736 | 0,00 | 1.960 | 4,65 | ||||
| 2026-02-13 | 13F | Mariner, LLC | 9.558 | 0,00 | 409 | 4,60 | ||||
| 2026-01-14 | 13F | Longview Financial Advisors LLC | 30.091 | 1,70 | 1.289 | 6,44 | ||||
| 2026-02-11 | 13F | Vise Technologies, Inc. | 19.336 | 270,63 | 828 | 288,73 | ||||
| 2026-02-09 | 13F | Robinson Smith Wealth Advisors Llc | 10.347 | 35,04 | 443 | 41,53 | ||||
| 2026-01-23 | 13F | Bridgewater Advisors Inc. | 18.471 | 21,07 | 817 | 31,40 | ||||
| 2026-02-05 | 13F | Cambridge Investment Research Advisors, Inc. | 5.874 | 0 | ||||||
| 2026-01-28 | 13F | Glassman Wealth Services | 11.598 | -1,93 | 497 | 2,48 | ||||
| 2026-01-29 | 13F | Aspen Capital Management, LLC | 91.657 | 7,43 | 3.927 | 12,42 | ||||
| 2026-02-17 | 13F | Royal Bank Of Canada | 1.284 | 116,53 | 55 | 129,17 | ||||
| 2025-11-12 | 13F | Willow Creek Wealth Management Inc. | 257.374 | 1,27 | 10.539 | 5,23 | ||||
| 2026-02-09 | 13F | Flagstone Financial Management | 19.147 | 8,39 | 820 | 13,42 | ||||
| 2026-02-03 | 13F | McIlrath & Eck, LLC | 129 | 0,00 | 6 | 0,00 | ||||
| 2026-02-20 | 13F | SB Capital Management Inc | 31.166 | 1.335 | ||||||
| 2026-02-05 | 13F | Blume Capital Management, Inc. | 150 | 0,00 | 6 | 0,00 | ||||
| 2026-01-27 | 13F | Joel Adams & Associates, Inc. | 8.193 | 3,88 | 351 | 9,01 | ||||
| 2026-02-04 | 13F | Rockbridge Investment Management, LCC | 69.148 | 0,43 | 2.963 | 5,07 |