Statistik Dasar
| Pemilik Institusi | 219 total, 218 long only, 0 short only, 1 long/short - change of -11,34% MRQ |
| Harga Saham | 13,90 |
| Alokasi Portofolio Rata-rata | 0.0479 % - change of -44,65% MRQ |
| Saham Institusi (Long) | 64.706.446 (ex 13D/G) - change of -5,03MM shares -7,21% MRQ |
| Nilai Institusi (Long) | $ 834.279 USD ($1000) |
Kepemilikan Institusi dan Pemegang Saham
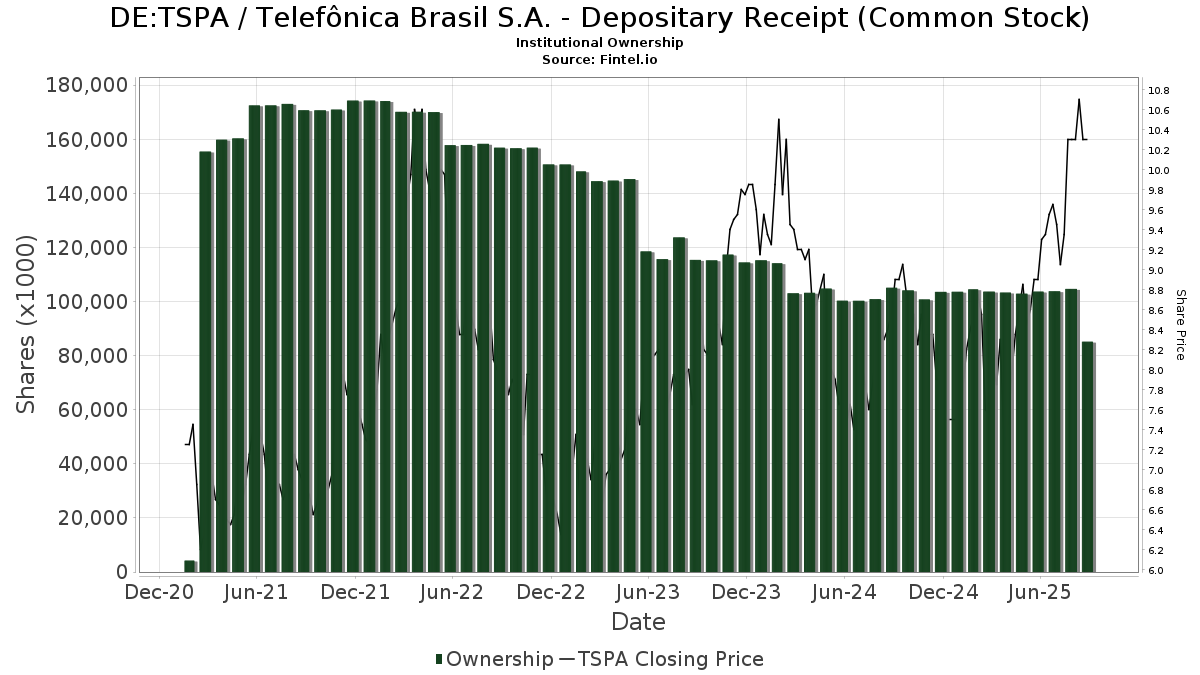
Telefônica Brasil S.A. - Depositary Receipt (Common Stock) (DE:TSPA) punya 219 pemilik institusi dan pemegang saham yang telah mengajukan formulir 13D/G atau 13F ke Securities Exchange Commission (SEC). Institusi-institusi ini memiliki total 64,706,446 saham. Pemegang saham terbesar termasuk Robeco Institutional Asset Management B.V., BlackRock, Inc., Arrowstreet Capital, Limited Partnership, Invesco Ltd., Standard Life Aberdeen plc, Brandes Investment Partners, Lp, Delaware Management Holdings, Inc., Renaissance Technologies Llc, Two Sigma Investments, Lp, and Amundi .
Telefônica Brasil S.A. - Depositary Receipt (Common Stock) (DB:TSPA) struktur kepemilikan institusi menunjukkan posisi saat ini di perusahaan menurut institusi dan dana, serta perubahan terkini dalam ukuran posisi. Pemegang saham utama dapat mencakup investor individu, reksa dana, hedge funds, atau institusi. Jadwal 13D menunjukkan bahwa investor memegang lebih dari 5% saham perusahaan dan bermaksud untuk secara aktif melakukan perubahan dalam strategi bisnis. Jadwal 13G menunjukkan investasi pasif lebih dari 5%.
The share price as of April 21, 2026 is 13,90 / share. Previously, on April 23, 2025, the share price was 7,95 / share. This represents an increase of 74,84% over that period.
Skor Sentimen Dana
Skor Sentimen Dana (Ownership Accumulation Score) menemukan saham-saham yang paling banyak dibeli oleh dana. Hal ini merupakan hasil dari model kuantitatif multifaktor yang canggih yang mengidentifikasi perusahaan-perusahaan dengan tingkat akumulasi institusi tertinggi. Model penilaian menggunakan kombinasi total peningkatan pemilik yang diungkapkan, perubahan alokasi portofolio pada pemilik tersebut, dan metrik lainnya. Angka tersebut berkisar dari 0 hingga 100, dengan angka yang lebih tinggi menunjukkan tingkat akumulasi yang lebih tinggi terhadap rekan-rekannya, dan 50 adalah rata-ratanya.
Frekuensi Pembaruan: Harian
Lihat Penjelajah Kepemilikan, yang menyediakan daftar perusahaan dengan peringkat tertinggi.
AI+ Ask Fintel’s AI assistant about Telefônica Brasil S.A. - Depositary Receipt (Common Stock).
Select a question to share a public post with an AI-crafted answer.
Thinking of good questions…
Pengajuan 13F dan NPORT
Detail pengajuan 13F gratis. Detail pengajuan NP memerlukan keanggotaan premium. Baris hijau menunjukkan posisi baru. Baris merah menunjukkan posisi yang sudah ditutup. Klik tautannya ikon untuk melihat riwayat transaksi lengkap.
Upgrade
untuk membuka data premium dan mengekspor ke Excel ![]() .
.
| Tanggal Berkas | Sumber | Investor | Jenis | Harga Rata-rata (Perkiraan) |
Saham | Δ Saham (%) |
Dilaporkan Nilai ($1000) |
Δ Nilai (%) |
Alokasi Portofolio (%) |
|
|---|---|---|---|---|---|---|---|---|---|---|
| 2026-04-21 | 13F | Financial Consulate, Inc | 174 | 656,52 | 3 | |||||
| 2025-11-14 | 13F | Eqis Capital Management, Inc. | 0 | -100,00 | 0 | |||||
| 2026-02-17 | 13F | Qube Research & Technologies Ltd | 94.595 | 12,32 | 1.122 | 4,47 | ||||
| 2026-02-13 | 13F | Arrowstreet Capital, Limited Partnership | 5.007.497 | -12,65 | 59.389 | -18,75 | ||||
| 2026-01-28 | 13F | HB Wealth Management, LLC | 12.936 | 153 | ||||||
| 2026-02-06 | 13F | EverSource Wealth Advisors, LLC | 6.104 | 18,64 | 72 | 10,77 | ||||
| 2026-04-21 | 13F | Vise Technologies, Inc. | 12.819 | 0,00 | 152 | 0,00 | ||||
| 2025-11-06 | 13F | Ameritas Advisory Services, LLC | 0 | -100,00 | 0 | -100,00 | ||||
| 2026-02-05 | 13F | Abacus Wealth Partners, LLC | 88.602 | 1.051 | ||||||
| 2026-02-13 | 13F | Integrated Wealth Concepts LLC | 0 | -100,00 | 0 | |||||
| 2026-02-10 | 13F | Savant Capital, LLC | 12.646 | -25,69 | 150 | -31,02 | ||||
| 2026-02-17 | 13F | Graham Capital Management, L.P. | 13.048 | 155 | ||||||
| 2026-02-09 | 13F | MQS Management LLC | 19.456 | 231 | ||||||
| 2026-02-06 | 13F | Pnc Financial Services Group, Inc. | 4.178 | -16,27 | 50 | -22,22 | ||||
| 2026-02-06 | 13F | Global Retirement Partners, LLC | 316 | -24,76 | 4 | -40,00 | ||||
| 2026-02-12 | 13F | Quadrant Capital Group Llc | 11.555 | 1,73 | 137 | -4,86 | ||||
| 2026-04-21 | 13F | Robeco Institutional Asset Management B.V. | 17.711.404 | 3,30 | 281.788 | 38,58 | ||||
| 2026-02-12 | 13F | Barometer Capital Management Inc. | 0 | -100,00 | 0 | |||||
| 2026-01-16 | 13F | Standard Life Aberdeen plc | 2.949.455 | 1,30 | 34.981 | -4,35 | ||||
| 2026-04-20 | 13F | TrueMark Investments, LLC | 267.445 | 4.255 | ||||||
| 2026-01-28 | 13F | Kapitalo Investimentos Ltda | 355.066 | 4.211 | ||||||
| 2026-02-18 | 13F | Vident Advisory, LLC | 88.512 | 17,71 | 1.050 | 9,50 | ||||
| 2026-02-17 | 13F | Ancora Advisors, LLC | 18 | 0 | ||||||
| 2026-02-17 | 13F | XTX Topco Ltd | 52.763 | -16,70 | 626 | -22,55 | ||||
| 2026-02-17 | 13F | Tower Research Capital LLC (TRC) | 70 | -93,09 | 1 | -100,00 | ||||
| 2026-01-30 | 13F | Caldwell Securities, Inc | 202 | 0,00 | 2 | 0,00 | ||||
| 2026-02-13 | 13F | Mml Investors Services, Llc | 36.943 | -2,93 | 438 | -9,69 | ||||
| 2026-02-09 | 13F | Coldstream Capital Management Inc | 11.802 | 6,04 | 140 | -1,42 | ||||
| 2026-02-03 | 13F | Crossmark Global Holdings, Inc. | 20.298 | -40,20 | 241 | -44,44 | ||||
| 2026-02-13 | 13F | First Trust Advisors Lp | 536.811 | -2,47 | 6.367 | -9,28 | ||||
| 2026-02-02 | 13F | Montag A & Associates Inc | 418 | -27,93 | 5 | -42,86 | ||||
| 2026-01-29 | 13F | Sanctuary Advisors, LLC | 12.185 | -0,29 | 145 | -7,10 | ||||
| 2026-01-22 | 13F | Personal Cfo Solutions, Llc | 20.682 | 5,67 | 245 | -1,61 | ||||
| 2026-02-17 | 13F | Public Employees Retirement System Of Ohio | 0 | -100,00 | 0 | |||||
| 2026-01-16 | 13F | Crewe Advisors LLC | 146 | 0,00 | 2 | 0,00 | ||||
| 2025-11-14 | 13F | Driehaus Capital Management Llc | 0 | -100,00 | 0 | |||||
| 2026-01-28 | 13F | B. Metzler seel. Sohn & Co. AG | 36.356 | 88,44 | 431 | 75,92 | ||||
| 2026-02-12 | 13F | Skopos Labs, Inc. | 45.707 | 302,70 | 541 | 328,57 | ||||
| 2026-02-05 | 13F | May Hill Capital, LLC | 13.606 | 161 | ||||||
| 2026-02-13 | 13F | Barclays Plc | 476.066 | -34,83 | 5.646 | -39,38 | ||||
| 2026-02-05 | 13F | Atria Investments Llc | 33.089 | -2,62 | 392 | -9,47 | ||||
| 2026-02-10 | 13F | Connor, Clark & Lunn Investment Management Ltd. | 46.210 | 548 | ||||||
| 2026-02-04 | 13F | D'Orazio & Associates, Inc. | 27.023 | 7,26 | 320 | -0,31 | ||||
| 2026-02-06 | 13F | Larson Financial Group LLC | 87 | 0,00 | 1 | 0,00 | ||||
| 2026-02-12 | 13F | Callan Family Office, LLC | 49.744 | 590 | ||||||
| 2026-02-11 | 13F | O'shaughnessy Asset Management, Llc | 1.042.457 | 2,59 | 12.364 | -4,57 | ||||
| 2025-12-15 | 13F | FNY Investment Advisers, LLC | 0 | -100,00 | 0 | |||||
| 2025-11-14 | 13F | AXA Investment Managers S.A. | 63.238 | 806 | ||||||
| 2026-02-02 | 13F | Mutual Advisors, LLC | 13.674 | -5,77 | 162 | -10,00 | ||||
| 2026-02-17 | 13F | Raymond James Financial Inc | 65.862 | -15,40 | 781 | -21,27 | ||||
| 2026-02-17 | 13F | Bank Of America Corp /de/ | 946.935 | 193,53 | 11.231 | 173,04 | ||||
| 2026-02-12 | 13F | Brown Brothers Harriman & Co | 108 | 0,00 | 1 | 0,00 | ||||
| 2026-01-26 | 13F | Cwm, Llc | 20.924 | 0 | ||||||
| 2026-04-13 | 13F | IFP Advisors, Inc | 2.750 | -3,47 | 44 | 30,30 | ||||
| 2026-02-12 | 13F | Principal Securities, Inc. | 0 | -100,00 | 0 | -100,00 | ||||
| 2026-02-17 | 13F | Aqr Capital Management Llc | 28.324 | -3,57 | 336 | -10,43 | ||||
| 2026-02-12 | 13F | Wealthspire Advisors, LLC | 0 | -100,00 | 0 | |||||
| 2026-02-12 | 13F | Federation des caisses Desjardins du Quebec | 2.000 | 0,00 | 24 | -8,00 | ||||
| 2026-02-17 | 13F | Millennium Management Llc | 23.619 | -93,98 | 280 | -94,40 | ||||
| 2026-02-17 | 13F | Wellington Management Group Llp | 227.786 | -35,03 | 2.702 | -39,57 | ||||
| 2026-02-13 | 13F | Morgan Stanley | 1.141.576 | 69,97 | 13.539 | 58,11 | ||||
| 2026-02-11 | 13F | Franklin Resources Inc | 73.989 | 2,96 | 878 | -4,26 | ||||
| 2026-02-11 | 13F | Simplex Trading, Llc | Put | 300 | 4 | |||||
| 2026-02-11 | 13F | Simplex Trading, Llc | Call | 2.900 | 141,67 | 34 | ||||
| 2026-02-13 | 13F | Verition Fund Management LLC | 0 | -100,00 | 0 | |||||
| 2026-02-10 | 13F | Goldman Sachs Group Inc | 264.361 | 78,11 | 3.135 | 65,70 | ||||
| 2026-02-11 | 13F | Ramirez Asset Management, Inc. | 451.081 | 5.350 | ||||||
| 2025-11-06 | 13F | Waterfront Wealth Inc. | 0 | -100,00 | 0 | |||||
| 2026-02-19 | 13F | Mcguire Capital Advisors Inc | 14.331 | 170 | ||||||
| 2026-01-29 | 13F | Aprio Wealth Management, LLC | 39.645 | 2,18 | 470 | -4,86 | ||||
| 2026-02-13 | 13F | Baird Financial Group, Inc. | 45.801 | 10,48 | 543 | 2,84 | ||||
| 2026-02-02 | 13F | Oppenheimer Asset Management Inc. | 19.513 | -28,86 | 231 | -33,81 | ||||
| 2026-01-22 | 13F | Lesa Sroufe & Co | 224.233 | 0,05 | 3 | 0,00 | ||||
| 2026-02-17 | 13F | Aquatic Capital Management LLC | 0 | -100,00 | 0 | |||||
| 2026-02-17 | 13F/A | Beverly Hills Private Wealth, LLC | 30.320 | -12,06 | 360 | -18,22 | ||||
| 2026-04-20 | 13F | Sowell Financial Services LLC | 10.089 | 161 | ||||||
| 2026-02-17 | 13F | Fmr Llc | 8.837 | 8,59 | 105 | 0,97 | ||||
| 2026-04-22 | 13F | Spire Wealth Management | 829 | 0,00 | 13 | 44,44 | ||||
| 2026-02-19 | 13F | First Growth Capital LLC | 13.061 | 206 | ||||||
| 2026-03-09 | 13F/A | CI Private Wealth, LLC | 22.060 | 2,38 | 262 | -4,74 | ||||
| 2026-02-17 | 13F | Optiver Holding B.V. | 75.746 | 486,95 | 898 | 447,56 | ||||
| 2026-04-21 | 13F | PharVision Advisers, LLC | 0 | -100,00 | 0 | |||||
| 2026-02-12 | 13F | Steward Partners Investment Advisory, Llc | 354 | -3,80 | 4 | 0,00 | ||||
| 2026-04-22 | 13F | Janney Montgomery Scott LLC | 14.155 | 0 | ||||||
| 2026-01-13 | 13F | Kathmere Capital Management, LLC | 71.277 | 6,85 | 845 | -0,59 | ||||
| 2026-02-02 | 13F | Strs Ohio | 715.109 | -14,87 | 8.481 | -20,81 | ||||
| 2025-10-28 | 13F | Arlington Trust Co LLC | 0 | -100,00 | 0 | |||||
| 2026-04-10 | 13F | Country Trust Bank | 432 | -21,74 | 7 | 0,00 | ||||
| 2026-02-17 | 13F | Amundi | 1.261.713 | 3,35 | 14.964 | -1,31 | ||||
| 2026-04-14 | 13F | Nbc Securities, Inc. | 21.606 | -0,69 | 344 | 32,95 | ||||
| 2026-01-23 | 13F | Sumitomo Mitsui Trust Holdings, Inc. | 165.187 | 6,10 | 1.959 | -1,31 | ||||
| 2026-02-18 | 13F | GWM Advisors LLC | 0 | -100,00 | 0 | |||||
| 2026-02-17 | 13F | Engineers Gate Manager LP | 32.550 | 14,70 | 386 | 6,93 | ||||
| 2026-01-23 | 13F | Assetmark, Inc | 221 | 206,94 | 3 | |||||
| 2026-04-08 | 13F | Legacy Wealth Asset Management, LLC | 61.819 | -0,62 | 984 | 33,38 | ||||
| 2026-02-10 | 13F | Natixis Advisors, L.p. | 0 | -100,00 | 0 | |||||
| 2026-02-17 | 13F | Susquehanna International Group, Llp | 40.662 | 482 | ||||||
| 2026-02-17 | 13F | State Of Wisconsin Investment Board | 0 | -100,00 | 0 | |||||
| 2026-02-17 | 13F | Susquehanna International Group, Llp | Call | 15.600 | 185 | |||||
| 2026-02-12 | 13F | Campbell & CO Investment Adviser LLC | 0 | -100,00 | 0 | |||||
| 2026-02-13 | 13F | Ieq Capital, Llc | 22.285 | 3,37 | 264 | -3,65 | ||||
| 2026-02-17 | 13F | Guggenheim Capital Llc | 27.008 | 33,27 | 320 | 24,03 | ||||
| 2025-11-20 | 13F | First Affirmative Financial Network | 33.558 | 3,43 | 428 | 15,72 | ||||
| 2025-10-24 | 13F | Hemington Wealth Management | 711 | 0,00 | 0 | |||||
| 2026-01-29 | 13F | Vanguard Group Inc | 902.856 | -3,59 | 10.708 | -10,32 | ||||
| 2026-02-13 | 13F | JustInvest LLC | 59.933 | 2,50 | 711 | -4,70 | ||||
| 2026-02-13 | 13F | Squarepoint Ops LLC | 0 | -100,00 | 0 | |||||
| 2026-04-22 | 13F | Pinnacle Bancorp, Inc. | 383 | 0,00 | 6 | 50,00 | ||||
| 2026-02-09 | 13F | Bleakley Financial Group, LLC | 27.841 | 330 | ||||||
| 2026-02-12 | 13F | Gould Capital, LLC | 150 | 0,00 | 2 | 0,00 | ||||
| 2025-11-12 | 13F | NewSquare Capital LLC | 0 | -100,00 | 0 | |||||
| 2026-02-11 | 13F | Simplex Trading, Llc | 0 | -100,00 | 0 | |||||
| 2026-02-10 | 13F | Envestnet Asset Management Inc | 743.766 | -1,94 | 8.821 | -8,78 | ||||
| 2026-02-10 | 13F | Bank of New York Mellon Corp | 10.027 | 119 | ||||||
| 2026-02-12 | 13F | Jane Street Group, Llc | 34.701 | -45,60 | 412 | -49,45 | ||||
| 2026-02-13 | 13F | State Street Corp | 130.225 | -36,14 | 1.596 | -39,77 | ||||
| 2026-02-17 | 13F | Delaware Management Holdings, Inc. | 2.207.970 | 26.187 | ||||||
| 2026-04-13 | 13F | True Wealth Design, LLC | 130 | 188,89 | 2 | |||||
| 2026-04-07 | 13F | Signaturefd, Llc | 24.264 | -0,58 | 386 | 33,56 | ||||
| 2026-01-28 | 13F | CAPROCK Group, Inc. | 175.467 | 1,11 | 2.096 | -3,50 | ||||
| 2025-11-13 | 13F | Empowered Funds, LLC | 0 | -100,00 | 0 | |||||
| 2026-02-17 | 13F | Lazard Asset Management Llc | 27.383 | 0,00 | 325 | -7,16 | ||||
| 2026-01-27 | 13F | WealthCollab, LLC | 1.074 | 8,05 | 13 | 0,00 | ||||
| 2026-01-30 | 13F/A | M&t Bank Corp | 25.164 | -0,09 | 298 | -7,17 | ||||
| 2026-02-12 | 13F | Bank Of Montreal /can/ | 69.005 | 25,32 | 818 | 16,52 | ||||
| 2026-04-14 | 13F | BSW Wealth Partners | 36.070 | -1,99 | 574 | 31,42 | ||||
| 2026-02-12 | 13F | BlackRock, Inc. | 6.909.289 | 34,97 | 81.944 | 25,55 | ||||
| 2026-02-11 | 13F | Longfellow Investment Management Co Llc | 173.816 | -33,16 | 2.061 | -37,83 | ||||
| 2026-02-12 | 13F | Banco BTG Pactual S.A. | 59.600 | 707 | ||||||
| 2026-02-17 | 13F | Two Sigma Advisers, Lp | 439.400 | -31,60 | 5.211 | -36,37 | ||||
| 2026-02-13 | 13F | MAI Capital Management | 33 | 73,68 | 0 | |||||
| 2026-04-20 | 13F | Ritholtz Wealth Management | 161.382 | -7,85 | 2.568 | 23,59 | ||||
| 2025-11-12 | 13F | Headlands Technologies LLC | 0 | -100,00 | 0 | |||||
| 2026-04-16 | 13F | SG Americas Securities, LLC | 10.347 | 11,46 | 0 | |||||
| 2026-02-11 | 13F | Jpmorgan Chase & Co | 127.095 | 43,69 | 1.507 | 33,72 | ||||
| 2026-02-13 | 13F | Great West Life Assurance Co /can/ | 167.852 | 0,00 | 2 | -50,00 | ||||
| 2026-02-17 | 13F | Mercer Global Advisors Inc /adv | 25.651 | -0,04 | 304 | -7,03 | ||||
| 2026-02-20 | 13F | Dorsey Wright & Associates | 128.702 | 3,96 | 1.526 | -3,30 | ||||
| 2026-02-17 | 13F | Royal Bank Of Canada | 390.159 | 1,94 | 4.627 | -5,16 | ||||
| 2026-02-13 | 13F | National Bank Of Canada /fi/ | 1.348 | 16 | ||||||
| 2026-04-06 | 13F | GAMMA Investing LLC | 10.887 | 0,71 | 173 | 35,16 | ||||
| 2025-11-14 | 13F | Cubist Systematic Strategies, LLC | 197.183 | 2.343,10 | 2.514 | 2.632,61 | ||||
| 2026-02-12 | 13F | Hrt Financial Lp | 0 | -100,00 | 0 | |||||
| 2026-02-17 | 13F | Ameriprise Financial Inc | 355.991 | 8,08 | 4.223 | 0,50 | ||||
| 2026-04-20 | 13F | Ronald Blue Trust, Inc. | 10.209 | -0,93 | 162 | 32,79 | ||||
| 2026-02-17 | 13F | SageView Advisory Group, LLC | 244 | 3 | ||||||
| 2025-11-12 | 13F | Fox Run Management, L.l.c. | 0 | -100,00 | 0 | |||||
| 2026-02-10 | 13F | Acadian Asset Management Llc | 6.219 | -78,98 | 0 | |||||
| 2026-02-03 | 13F | Ballentine Partners, LLC | 52.670 | -8,91 | 625 | -15,33 | ||||
| 2026-02-12 | 13F | Renaissance Technologies Llc | 1.493.100 | -11,26 | 17.708 | -17,45 | ||||
| 2026-02-02 | 13F | Truist Financial Corp | 64.049 | 3,30 | 760 | -3,92 | ||||
| 2026-02-12 | 13F/A | Pinebridge Investments Llc | 68.223 | 809 | ||||||
| 2026-02-11 | 13F | Group One Trading, L.p. | Call | 700 | 8 | |||||
| 2026-02-11 | 13F | Cerity Partners LLC | 125.512 | 0,11 | 1.489 | -6,88 | ||||
| 2026-02-12 | 13F | Advisors Asset Management, Inc. | 10.304 | 35,21 | 122 | 25,77 | ||||
| 2026-02-10 | 13F | Bnp Paribas Arbitrage, Sa | 101.409 | 23,05 | 1.203 | 14,48 | ||||
| 2026-01-29 | 13F | UBS Group AG | 83.422 | -43,75 | 989 | -47,67 | ||||
| 2026-01-21 | 13F | Westfuller Advisors, LLC | 4.580 | -1,38 | 55 | -8,47 | ||||
| 2026-04-20 | 13F | Jfs Wealth Advisors, Llc | 91 | 0,00 | 1 | 0,00 | ||||
| 2026-02-10 | 13F | Eurizon Capital SGR S.p.A. | 895 | 11 | ||||||
| 2026-02-13 | 13F | Citigroup Inc | 173.883 | 345,84 | 2.062 | 314,89 | ||||
| 2026-04-15 | 13F | Alhambra Investment Partners LLC | 10.810 | -10,13 | 172 | 20,42 | ||||
| 2025-11-14 | 13F | Axa S.a. | 0 | -100,00 | 0 | |||||
| 2026-04-20 | 13F | Kestra Private Wealth Services, Llc | 21.166 | -20,54 | 337 | 6,67 | ||||
| 2026-02-10 | 13F/A | Northwestern Mutual Wealth Management Co | 2.821 | -39,77 | 33 | -44,07 | ||||
| 2026-02-17 | 13F | Two Sigma Investments, Lp | 1.309.261 | -21,74 | 15.528 | -27,21 | ||||
| 2026-04-02 | 13F | Ares Financial Consulting, LLC | 122 | 0,00 | 2 | 0,00 | ||||
| 2026-01-30 | 13F | R Squared Ltd | 0 | -100,00 | 0 | |||||
| 2026-02-24 | 13F | DGS Capital Management, LLC | 110.166 | -1,53 | 1.307 | -8,42 | ||||
| 2026-02-06 | 13F | Handelsbanken Fonder AB | 91.125 | 0,00 | 1 | 0,00 | ||||
| 2025-10-24 | 13F | JGP Global Gestao de Recursos Ltda. | 0 | -100,00 | 0 | |||||
| 2026-02-11 | 13F | Parallel Advisors, LLC | 27.508 | 4,59 | 326 | -2,69 | ||||
| 2026-02-13 | 13F | SRS Capital Advisors, Inc. | 3.773 | 54,44 | 45 | 41,94 | ||||
| 2026-02-13 | 13F | Smartleaf Asset Management LLC | 604 | 1.272,73 | 7 | |||||
| 2026-02-17 | 13F | Jones Financial Companies Lllp | 6.542 | 50,25 | 78 | 45,28 | ||||
| 2026-02-17 | 13F | Northern Trust Corp | 323.408 | -1,80 | 3.836 | -8,67 | ||||
| 2026-02-13 | 13F | Rhumbline Advisers | 6.655 | -21,25 | 79 | -27,10 | ||||
| 2026-02-17 | 13F | Quantinno Capital Management LP | 169.265 | 24,21 | 2.007 | 15,54 | ||||
| 2026-02-13 | 13F | American Century Companies Inc | 181.812 | 1,45 | 2.156 | -5,65 | ||||
| 2026-02-17 | 13F | Modern Wealth Management, LLC | 63.066 | -3,73 | 748 | -10,54 | ||||
| 2026-02-13 | 13F | Marshall Wace, Llp | 24.081 | 286 | ||||||
| 2026-02-09 | 13F | Huntington National Bank | 1 | 0,00 | 0 | |||||
| 2025-11-14 | 13F | Two Sigma Securities, Llc | 0 | -100,00 | 0 | |||||
| 2026-02-13 | 13F | Virtus ETF Advisers LLC | 27 | 0 | ||||||
| 2026-02-17 | 13F | Point72 Asset Management, L.P. | 342.796 | -10,45 | 4.066 | -16,70 | ||||
| 2026-02-03 | 13F | Navigoe, LLC | 98 | 0,00 | 0 | |||||
| 2025-11-14 | 13F | Wetherby Asset Management Inc | 84.863 | 4,13 | 1.082 | 16,47 | ||||
| 2026-01-28 | 13F | DekaBank Deutsche Girozentrale | 19.293 | 0,00 | 0 | |||||
| 2026-02-13 | 13F | AlTi Global, Inc. | 10.986 | 130 | ||||||
| 2026-04-03 | 13F | Investors Research Corp | 0 | -100,00 | 0 | |||||
| 2026-02-12 | 13F | Dimensional Fund Advisors Lp | 561.254 | 8,84 | 6.662 | 1,45 | ||||
| 2026-02-13 | 13F | Macquarie Group Ltd | 0 | -100,00 | 0 | |||||
| 2026-02-05 | 13F | Bessemer Group Inc | 32.680 | -0,84 | 0 | |||||
| 2026-02-03 | 13F | Sageworth Trust Co | 0 | -100,00 | 0 | -100,00 | ||||
| 2026-02-09 | 13F | Hantz Financial Services, Inc. | 105.793 | -23,49 | 1 | 0,00 | ||||
| 2026-01-20 | 13F | Ascent Group, LLC | 22.638 | -1,67 | 268 | -8,53 | ||||
| 2026-01-26 | 13F | Private Trust Co Na | 844 | 0,00 | 10 | 0,00 | ||||
| 2026-02-09 | 13F | Legal & General Group Plc | 84.000 | 0,00 | 998 | -7,00 | ||||
| 2026-02-03 | 13F | Sequoia Financial Advisors, LLC | 44.976 | 4,01 | 533 | -3,27 | ||||
| 2026-04-07 | 13F | Farther Finance Advisors, LLC | 8.584 | 5,66 | 139 | 43,75 | ||||
| 2026-02-03 | 13F | Diversify Wealth Management, Llc | 106.644 | 8,17 | 1.286 | 8,52 | ||||
| 2026-02-13 | 13F | Mariner, LLC | 48.249 | 0,04 | 572 | -6,84 | ||||
| 2026-02-12 | 13F | Federated Hermes, Inc. | 470.737 | -5,24 | 5.583 | -11,86 | ||||
| 2026-01-14 | 13F | Stegent Equity Advisors, Inc. | 154.027 | 6,67 | 1.827 | -0,76 | ||||
| 2026-02-10 | 13F | CIBC World Markets Inc. | 208.829 | -0,52 | 2.477 | -7,47 | ||||
| 2026-01-21 | 13F/A | Euro Pacific Asset Management, LLC | 10.534 | 0 | ||||||
| 2026-02-13 | 13F | VPR Management LLC | 41.185 | 0,00 | 488 | -7,05 | ||||
| 2026-02-13 | 13F | SPX Equities Gestao de Recursos Ltda | 0 | 0 | ||||||
| 2026-01-30 | 13F | Carrera Capital Advisors | 327.079 | -4,93 | 3.879 | -11,56 | ||||
| 2026-02-03 | 13F | Ethic Inc. | 186.373 | 13,39 | 2.210 | 5,49 | ||||
| 2026-04-22 | 13F | ABN AMRO Bank N.V. | 122.351 | -4,53 | 1.958 | 29,33 | ||||
| 2026-02-03 | 13F | SBI Securities Co., Ltd. | 3.820 | -7,57 | 45 | -13,46 | ||||
| 2026-02-11 | 13F | LPL Financial LLC | 331.853 | 7,42 | 3.936 | -0,08 | ||||
| 2026-02-11 | 13F | Brandes Investment Partners, Lp | 2.277.427 | -13,76 | 27.010 | -19,78 | ||||
| 2026-02-05 | 13F | Gabelli Funds Llc | 268.000 | 0,00 | 3.178 | -6,99 | ||||
| 2026-01-30 | 13F | Us Bancorp \de\ | 46.422 | -1,74 | 551 | -8,64 | ||||
| 2026-02-13 | 13F | Wells Fargo & Company/mn | 527.177 | -4,05 | 6.252 | -10,75 | ||||
| 2026-03-03 | 13F/A | Caitong International Asset Management Co., Ltd | 66 | 3.200,00 | 1 | |||||
| 2026-01-21 | 13F | Newbridge Financial Services Group, Inc. | 37.588 | 446 | ||||||
| 2026-01-29 | 13F | UMA Financial Services, Inc. | 236 | 0,00 | 3 | -33,33 | ||||
| 2026-02-17 | 13F | Advisor Group Holdings, Inc. | 7.928 | 4,54 | 94 | 0,00 | ||||
| 2026-04-17 | 13F | Bell Investment Advisors, Inc | 103 | 68,85 | 2 | |||||
| 2026-02-13 | 13F | Pathstone Holdings, LLC | 0 | -100,00 | 0 | |||||
| 2026-01-29 | 13F | Quent Capital, LLC | 273 | 0,00 | 3 | 0,00 | ||||
| 2026-02-13 | 13F | Ubs Asset Management Americas Inc | 1.503 | 18 | ||||||
| 2026-02-18 | 13F | Garton & Associates Financial Advisors LLC | 448 | 5 | ||||||
| 2026-02-06 | 13F | Covestor Ltd | 477 | -1,65 | 0 | |||||
| 2026-02-17 | 13F | Voloridge Investment Management, Llc | 80.930 | -58,13 | 960 | -61,08 | ||||
| 2025-10-30 | 13F | Twin Peaks Wealth Advisors, LLC | 0 | -100,00 | 0 | |||||
| 2026-01-15 | 13F | Burns Matteson Capital Management, LLC | 20.158 | 6,94 | 239 | -0,42 | ||||
| 2026-02-19 | 13F | Atomi Financial Group, Inc. | 15.911 | 11,25 | 189 | 3,30 | ||||
| 2026-03-06 | 13F | Hsbc Holdings Plc | 190.168 | 26,45 | 2.259 | 17,79 | ||||
| 2026-02-12 | 13F | Xponance, Inc. | 10.841 | 6,07 | 129 | -1,54 | ||||
| 2026-02-19 | 13F | Invesco Ltd. | 3.094.219 | 8,32 | 36.697 | 0,76 | ||||
| 2026-02-17 | 13F | Creative Planning | 221.035 | 129,11 | 2.621 | 113,09 | ||||
| 2026-04-13 | 13F | Salem Investment Counselors Inc | 13 | 0 | ||||||
| 2026-01-14 | 13F | ORG Wealth Partners, LLC | 391 | 6,25 | 5 | 0,00 | ||||
| 2025-11-14 | 13F | PineBridge Investments, L.P. | 68.223 | 870 | ||||||
| 2026-01-26 | 13F | Mirae Asset Global Investments Co., Ltd. | 20.165 | 2,89 | 239 | -4,02 | ||||
| 2026-02-17 | 13F | Cetera Investment Advisers | 86.672 | 7,46 | 1.028 | -0,10 | ||||
| 2026-01-23 | 13F | Diversify Advisory Services, LLC | 38.800 | 10,99 | 468 | 11,19 | ||||
| 2026-02-13 | 13F | OMERS ADMINISTRATION Corp | 0 | -100,00 | 0 | |||||
| 2026-01-30 | 13F | CBOE Vest Financial, LLC | 21.743 | 52,64 | 258 | 41,99 | ||||
| 2026-02-17 | 13F | CWM Advisors, LLC | 57 | 1 | ||||||
| 2026-02-17 | 13F | Citadel Advisors Llc | 213.990 | -16,39 | 2.538 | -22,25 | ||||
| 2026-02-13 | 13F | Stifel Financial Corp | 131.558 | -4,50 | 1.560 | -11,16 | ||||
| 2026-02-13 | 13F | Toroso Investments, LLC | 73.427 | 34,20 | 871 | 24,82 | ||||
| 2026-02-17 | 13F | Advisory Services Network, LLC | 0 | -100,00 | 0 | |||||
| 2026-02-13 | 13F | Hudson Portfolio Management LLC | 15.694 | 64 | ||||||
| 2026-02-13 | 13F | Sei Investments Co | 14.651 | -16,25 | 174 | -22,42 | ||||
| 2026-02-17 | 13F | Laird Norton Trust Company, Llc | 88.795 | 1.061 | ||||||
| 2026-01-22 | 13F | V-Square Quantitative Management LLC | 74.455 | 6,55 | 883 | -0,79 | ||||
| 2026-02-17 | 13F | Parvin Asset Management, LLC | 6.775 | 0,00 | 80 | -6,98 | ||||
| 2026-02-17 | 13F | Wiley Bros.-aintree Capital, Llc | 21.716 | -0,42 | 258 | -7,55 | ||||
| 2026-02-05 | 13F | Allworth Financial LP | 2.435 | -25,88 | 29 | -31,71 | ||||
| 2026-02-10 | 13F | AdvisorShares Investments LLC | 83.927 | 0,34 | 995 | -6,66 | ||||
| 2026-02-14 | 13F | Rockefeller Capital Management L.P. | 165 | 83,33 | 2 | 0,00 | ||||
| 2026-02-10 | 13F | Quantbot Technologies LP | 0 | -100,00 | 0 | |||||
| 2026-02-18 | 13F | EP Wealth Advisors, Inc. | 11.401 | 135 |
Other Listings
| US:VIV | US$15,87 |