Statistik Dasar
| Pemilik Institusi | 210 total, 197 long only, 1 short only, 12 long/short - change of -40,51% MRQ |
| Alokasi Portofolio Rata-rata | 0.0345 % - change of -22,74% MRQ |
| Saham Beredar | shares (source: Capital IQ) |
| Saham Institusi (Long) | 35.584.772 - 79,05% (ex 13D/G) - change of 1,80MM shares 5,34% MRQ |
| Nilai Institusi (Long) | $ 363.224 USD ($1000) |
Kepemilikan Institusi dan Pemegang Saham
Cerence Inc. (US:CRNC) punya 210 pemilik institusi dan pemegang saham yang telah mengajukan formulir 13D/G atau 13F ke Securities Exchange Commission (SEC). Institusi-institusi ini memiliki total 35,584,772 saham. Pemegang saham terbesar termasuk BlackRock, Inc., Vanguard Group Inc, American Capital Management Inc, Paradigm Capital Management Inc/ny, No Street GP LP, Connor, Clark & Lunn Investment Management Ltd., Dimensional Fund Advisors Lp, State Street Corp, Millennium Management Llc, and Geode Capital Management, Llc .
Cerence Inc. (NasdaqGS:CRNC) struktur kepemilikan institusi menunjukkan posisi saat ini di perusahaan menurut institusi dan dana, serta perubahan terkini dalam ukuran posisi. Pemegang saham utama dapat mencakup investor individu, reksa dana, hedge funds, atau institusi. Jadwal 13D menunjukkan bahwa investor memegang lebih dari 5% saham perusahaan dan bermaksud untuk secara aktif melakukan perubahan dalam strategi bisnis. Jadwal 13G menunjukkan investasi pasif lebih dari 5%.
The share price as of April 15, 2026 is 8,36 / share. Previously, on April 16, 2025, the share price was 7,34 / share. This represents an increase of 13,90% over that period.

Skor Sentimen Dana
Skor Sentimen Dana (Ownership Accumulation Score) menemukan saham-saham yang paling banyak dibeli oleh dana. Hal ini merupakan hasil dari model kuantitatif multifaktor yang canggih yang mengidentifikasi perusahaan-perusahaan dengan tingkat akumulasi institusi tertinggi. Model penilaian menggunakan kombinasi total peningkatan pemilik yang diungkapkan, perubahan alokasi portofolio pada pemilik tersebut, dan metrik lainnya. Angka tersebut berkisar dari 0 hingga 100, dengan angka yang lebih tinggi menunjukkan tingkat akumulasi yang lebih tinggi terhadap rekan-rekannya, dan 50 adalah rata-ratanya.
Frekuensi Pembaruan: Harian
Lihat Penjelajah Kepemilikan, yang menyediakan daftar perusahaan dengan peringkat tertinggi.
AI+ Ask Fintel’s AI assistant about Cerence Inc..
Select a question to share a public post with an AI-crafted answer.
Thinking of good questions…
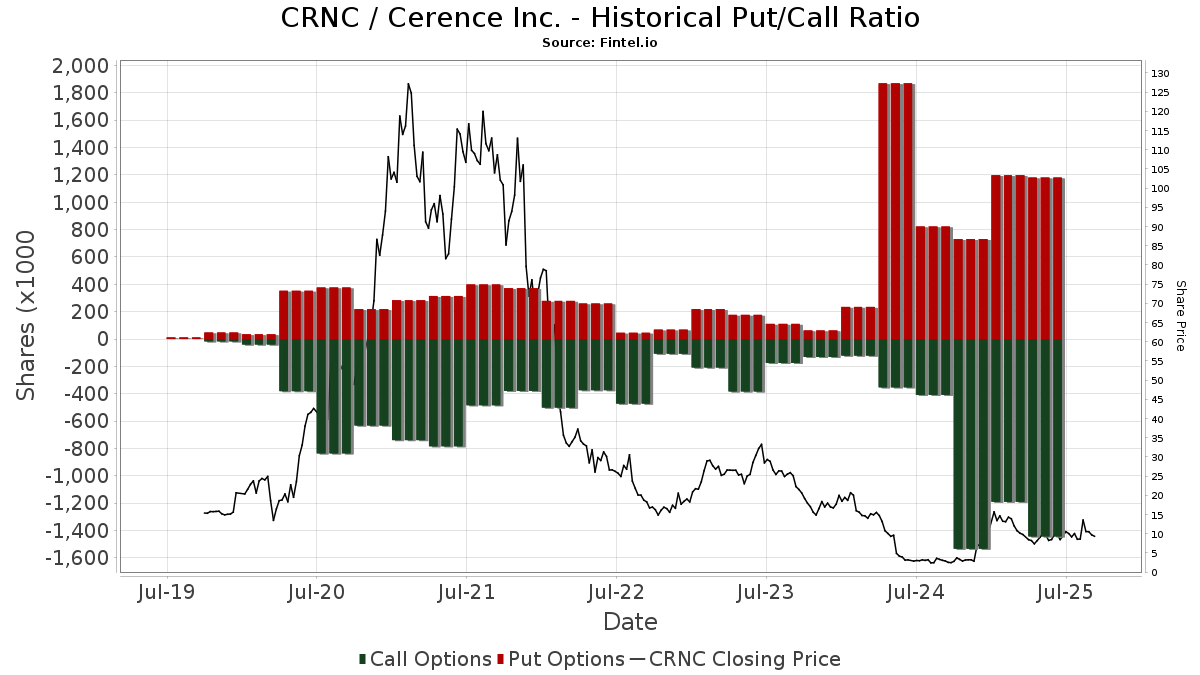
Rasio Put/Call Institusi
Selain melaporkan masalah ekuitas dan utang standar, institusi dengan lebih dari 100MM aset yang dikelola juga harus mengungkapkan kepemilikan opsi put dan call mereka. Karena opsi put umumnya mengindikasikan sentimen negatif, dan opsi call mengindikasikan sentimen positif, kita dapat memahami sentimen institusional secara keseluruhan dengan memplot rasio opsi put terhadap opsi call. Grafik di sebelah kanan menggambarkan rasio put/call historis untuk instrumen ini.
Penggunaan Rasio Put/Call sebagai indikator sentimen investor mengatasi salah satu kelemahan utama dalam menggunakan total kepemilikan institusional, yaitu sejumlah besar aset yang dikelola diinvestasikan secara pasif untuk melacak indeks. Dana yang dikelola secara pasif biasanya tidak membeli opsi sehingga indikator rasio put/call lebih dekat melacak sentimen dana yang dikelola secara aktif.
Pengajuan 13D/G
Kami menyajikan pengajuan 13D/G secara terpisah dari pengajuan 13F karena perlakuan berbeda dari SEC. Pengajuan 13D/G dapat diajukan oleh kelompok investor (dengan satu investor terkemuka), sedangkan pengajuan 13F tidak bisa. Hal ini mengakibatkan situasi di mana seorang investor dapat mengajukan 13D/G yang melaporkan satu nilai untuk total saham (mewakili seluruh saham yang dimiliki oleh kelompok investor), namun kemudian mengajukan 13F yang melaporkan nilai yang berbeda untuk total saham (yang hanya mewakili kepemilikan mereka sendiri). Artinya, kepemilikan saham atas pengajuan 13D/G dan pengajuan 13F seringkali tidak dapat dibandingkan secara langsung sehingga kami menyajikannya secara terpisah.
Catatan: Mulai 16 Mei 2021, kami tidak lagi menampilkan pemilik yang belum mengajukan 13D/G dalam setahun terakhir. Sebelumnya, kami menunjukkan riwayat lengkap pengajuan 13D/G. Secara umum, entitas yang wajib mengajukan pengajuan 13D/G harus mengajukan setidaknya satu tahun sekali sebelum mengajukan penutupan pengajuan. Namun, dana kadang-kadang keluar dari posisi tanpa menyerahkan pengajuan penutupan (yaitu, dana tersebut ditutup) sehingga menampilkan riwayat lengkap kadang-kadang mengakibatkan kebingungan tentang kepemilikan saat ini. Untuk mencegah kebingungan, kini kami hanya menampilkan pemilik saat ini - yaitu - pemilik yang telah mengajukan permohonan dalam setahun terakhir.
Upgrade to unlock premium data.
| Tanggal Berkas | Formulir | Investor | Sebelumnya Saham |
Terbaru Saham |
Δ Saham (Persentase) |
Kepemilikan (Persentase) |
Δ Kepemilikan (Persentase) |
|
|---|---|---|---|---|---|---|---|---|
| 2025-11-14 | PARADIGM CAPITAL MANAGEMENT INC/NY | 2,593,200 | 2,041,292 | -21.28 | 4.70 | -21.67 | ||
| 2025-05-15 | AMERICAN CAPITAL MANAGEMENT INC | 3,488,944 | 2,982,162 | -14.53 | 6.90 | -14.81 |
Pengajuan 13F dan NPORT
Detail pengajuan 13F gratis. Detail pengajuan NP memerlukan keanggotaan premium. Baris hijau menunjukkan posisi baru. Baris merah menunjukkan posisi yang sudah ditutup. Klik tautannya ikon untuk melihat riwayat transaksi lengkap.
Upgrade
untuk membuka data premium dan mengekspor ke Excel ![]() .
.
| Tanggal Berkas | Sumber | Investor | Jenis | Harga Rata-rata (Perkiraan) |
Saham | Δ Saham (%) |
Dilaporkan Nilai ($1000) |
Δ Nilai (%) |
Alokasi Portofolio (%) |
|
|---|---|---|---|---|---|---|---|---|---|---|
| 2026-01-23 | 13F | Steigerwald, Gordon & Koch Inc. | 62 | 0,00 | 1 | |||||
| 2026-02-09 | 13F | Geode Capital Management, Llc | 1.010.876 | 0,23 | 10.809 | -14,00 | ||||
| 2026-02-17 | 13F | Engineers Gate Manager LP | 72.425 | 774 | ||||||
| 2026-02-12 | 13F | BlackRock, Inc. | 3.846.492 | 2,28 | 41.119 | -12,25 | ||||
| 2026-02-11 | 13F | Los Angeles Capital Management Llc | 29.343 | 0,65 | 320 | -12,12 | ||||
| 2026-02-14 | 13F | Rockefeller Capital Management L.P. | 399 | 45,62 | 4 | 33,33 | ||||
| 2026-02-04 | 13F | Fourth Dimension Wealth, LLC | 119 | 0,00 | 1 | 0,00 | ||||
| 2026-02-04 | 13F | Versor Investments LP | 11.467 | 123 | ||||||
| 2026-02-24 | 13F/A | Pacer Advisors, Inc. | 159.524 | -11,34 | 1.705 | -23,92 | ||||
| 2025-11-14 | 13F | Ubs Asset Management Americas Inc | 0 | -100,00 | 0 | |||||
| 2026-02-13 | 13F | Stifel Financial Corp | 0 | -100,00 | 0 | |||||
| 2026-02-17 | 13F | Royal Bank Of Canada | 7.113 | -18,63 | 76 | -30,91 | ||||
| 2026-02-12 | 13F | Nuveen, LLC | 642.395 | 55,33 | 6.867 | 33,29 | ||||
| 2026-02-12 | 13F | New York State Common Retirement Fund | 11.549 | 0,00 | 123 | -13,99 | ||||
| 2026-02-13 | 13F | Parkside Financial Bank & Trust | 114 | 6,54 | 1 | 0,00 | ||||
| 2026-02-17 | 13F | Creative Planning | 11.354 | 121 | ||||||
| 2026-02-10 | 13F | Measured Wealth Private Client Group, LLC | 0 | 0 | ||||||
| 2026-02-17 | 13F | Balyasny Asset Management Llc | 191.286 | 27,81 | 2.045 | 9,66 | ||||
| 2026-02-13 | 13F | National Bank Of Canada /fi/ | 251 | 3 | ||||||
| 2026-02-10 | 13F | Acadian Asset Management Llc | 184.039 | -56,55 | 2 | -80,00 | ||||
| 2026-02-12 | 13F | Jane Street Group, Llc | 466.999 | 4.992 | ||||||
| 2026-02-12 | 13F | Jane Street Group, Llc | Put | 44.600 | -13,73 | 477 | -26,09 | |||
| 2026-02-12 | 13F | Jane Street Group, Llc | Call | 107.000 | -21,27 | 1.144 | -32,49 | |||
| 2026-02-17 | 13F | Tudor Investment Corp Et Al | 274.117 | 2.930 | ||||||
| 2026-02-13 | 13F | JustInvest LLC | 10.235 | 0,07 | 109 | -14,17 | ||||
| 2026-02-11 | 13F | Strategic Advocates LLC | 2 | 0,00 | 0 | |||||
| 2026-04-14 | 13F | Wealthcare Advisory Partners LLC | 17.509 | 1,11 | 110 | -40,54 | ||||
| 2026-02-17 | 13F | One Fin Capital Management LP | 720.000 | 53,19 | 7.697 | 31,42 | ||||
| 2026-02-13 | 13F | Citigroup Inc | 929 | -85,05 | 10 | -88,31 | ||||
| 2026-02-13 | 13F | Sei Investments Co | 35.676 | 381 | ||||||
| 2026-02-17 | 13F | Boreal Capital Management LLC | 9 | 0,00 | 0 | |||||
| 2026-01-30 | 13F | Us Bancorp \de\ | 3.307 | 316,50 | 35 | 288,89 | ||||
| 2026-02-05 | 13F | Pinnacle Associates Ltd | 33.093 | -5,33 | 354 | -18,85 | ||||
| 2026-02-10 | 13F | Goldman Sachs Group Inc | 799.776 | 15,19 | 8.550 | -1,18 | ||||
| 2026-02-11 | 13F | MCF Advisors LLC | 559 | 0,00 | 6 | -16,67 | ||||
| 2026-02-17 | 13F | MIRAE ASSET GLOBAL ETFS HOLDINGS Ltd. | 533.227 | 2,83 | 5.700 | -11,78 | ||||
| 2026-02-12 | 13F | State Board Of Administration Of Florida Retirement System | 11.516 | 0,00 | 123 | -13,99 | ||||
| 2026-02-17 | 13F | Millennium Management Llc | 1.156.018 | 1.622,57 | 12.358 | 1.378,11 | ||||
| 2025-12-15 | 13F | FNY Investment Advisers, LLC | Call | 0 | -100,00 | 0 | ||||
| 2026-04-13 | 13F | True Wealth Design, LLC | 1.487 | 1,43 | 9 | -40,00 | ||||
| 2026-02-13 | 13F | Bridgefront Capital, LLC | 30.998 | 331 | ||||||
| 2026-02-10 | 13F | Bank of New York Mellon Corp | 338.448 | -10,14 | 3.618 | -22,89 | ||||
| 2026-02-13 | 13F | Smartleaf Asset Management LLC | 184 | -7,54 | 2 | -50,00 | ||||
| 2026-04-06 | 13F | GAMMA Investing LLC | 1.659 | 63,13 | 10 | 0,00 | ||||
| 2026-02-12 | 13F | Peterson Wealth Services | 100 | 25,00 | 1 | 0,00 | ||||
| 2026-02-12 | 13F | Federation des caisses Desjardins du Quebec | 62 | 0,00 | 1 | |||||
| 2026-02-13 | 13F | Manufacturers Life Insurance Company, The | 0 | -100,00 | 0 | |||||
| 2026-02-13 | 13F | K2 Principal Fund, L.p. | Call | 50.000 | 534 | |||||
| 2026-02-13 | 13F | Barclays Plc | 67.839 | 19,03 | 725 | 2,11 | ||||
| 2026-02-17 | 13F | Aqr Capital Management Llc | 152.272 | -9,83 | 1.628 | -22,67 | ||||
| 2026-02-09 | 13F | Key FInancial Inc | 12 | -25,00 | 0 | |||||
| 2026-02-10 | 13F | Connor, Clark & Lunn Investment Management Ltd. | 1.337.253 | -9,39 | 14.295 | -22,26 | ||||
| 2026-02-12 | 13F | Skopos Labs, Inc. | 0 | -100,00 | 0 | |||||
| 2026-02-12 | 13F | EAM Investors, LLC | 53.134 | 0,00 | 568 | -14,20 | ||||
| 2026-02-06 | 13F | Gsa Capital Partners Llp | 166.578 | 48,27 | 2 | 0,00 | ||||
| 2025-11-04 | 13F | Guerra Advisors Inc | 25 | 0 | ||||||
| 2026-02-13 | 13F | Walleye Trading LLC | Call | 29.100 | 11,07 | 311 | -4,60 | |||
| 2025-10-22 | 13F | Commonwealth Equity Services, Llc | 0 | -100,00 | 0 | |||||
| 2026-02-17 | 13F | Graham Capital Management, L.P. | 47.347 | 506 | ||||||
| 2026-02-13 | 13F | Walleye Trading LLC | Put | 27.000 | -3,23 | 289 | -17,00 | |||
| 2026-02-13 | 13F | Sterling Capital Management LLC | 33.739 | 1.625,78 | 361 | 1.400,00 | ||||
| 2026-04-07 | 13F | Signaturefd, Llc | 1.528 | 0,00 | 10 | -43,75 | ||||
| 2025-11-14 | 13F | Lazard Asset Management Llc | 0 | -100,00 | 0 | |||||
| 2026-01-26 | 13F | Mirae Asset Global Investments Co., Ltd. | 8.289 | 9,01 | 89 | -6,38 | ||||
| 2026-02-03 | 13F | Pilgrim Partners Asia Pte Ltd | 8.600 | -56,12 | 92 | -62,70 | ||||
| 2026-04-15 | 13F | Fortitude Family Office, LLC | 9 | 0 | ||||||
| 2026-02-03 | 13F | Redwood Wealth Management Group, LLC | 29.165 | 3,13 | 312 | -11,65 | ||||
| 2026-01-29 | 13F | IMC-Chicago, LLC | Put | 79.200 | -9,38 | 847 | -22,31 | |||
| 2026-04-13 | 13F | Massmutual Trust Co Fsb/adv | 9 | 0 | ||||||
| 2026-01-29 | 13F | IMC-Chicago, LLC | Call | 148.800 | -16,78 | 1.591 | -28,60 | |||
| 2026-02-13 | 13F/A | Texas Permanent School Fund | 0 | -100,00 | 0 | |||||
| 2026-01-16 | 13F | FNY Investment Advisers, LLC | 0 | -100,00 | 0 | |||||
| 2026-02-17 | 13F | Advisory Services Network, LLC | 0 | -100,00 | 0 | |||||
| 2026-02-17 | 13F | Mercer Global Advisors Inc /adv | 15.394 | 165 | ||||||
| 2026-04-02 | 13F | Noble Wealth Management PBC | 44 | 0 | ||||||
| 2026-02-17 | 13F | No Street GP LP | 1.400.000 | 40,00 | 14.966 | 20,11 | ||||
| 2026-01-20 | 13F | Nvwm, Llc | 100 | 0,00 | 1 | 0,00 | ||||
| 2026-01-27 | 13F | Belpointe Asset Management LLC | 0 | -100,00 | 0 | -100,00 | ||||
| 2026-02-13 | 13F | State Street Corp | 1.206.703 | -7,44 | 12.900 | -20,59 | ||||
| 2026-02-18 | 13F | GWM Advisors LLC | 2.933 | -87,98 | 31 | -89,80 | ||||
| 2026-02-17 | 13F | D. E. Shaw & Co., Inc. | 131.975 | 38,10 | 1.411 | 18,49 | ||||
| 2025-11-21 | 13F/A | Royal Bank Of Canada | Call | 0 | -100,00 | 0 | -100,00 | |||
| 2026-02-13 | 13F | Missouri Trust & Investment Co | 34 | 0,00 | 0 | |||||
| 2026-02-11 | 13F | Deutsche Bank Ag\ | 33.915 | 4,89 | 363 | -9,95 | ||||
| 2026-01-09 | 13F | SG Americas Securities, LLC | 100.206 | 4,34 | 1 | 0,00 | ||||
| 2026-02-13 | 13F | Morgan Stanley | 724.578 | 48,06 | 7.746 | 27,03 | ||||
| 2026-02-09 | 13F | Quest Partners LLC | 15.180 | -56,53 | 162 | -62,76 | ||||
| 2026-02-17 | 13F | Jump Financial, LLC | 36.500 | 390 | ||||||
| 2025-10-24 | 13F | ORG Partners LLC | 0 | -100,00 | 0 | |||||
| 2026-02-13 | 13F | Squarepoint Ops LLC | 172.344 | 5,13 | 1.842 | -9,79 | ||||
| 2026-01-21 | 13F | Capital Advisors, Ltd. LLC | 81 | 0,00 | 0 | |||||
| 2026-02-09 | 13F | Legal & General Group Plc | 8.124 | -1,14 | 87 | -15,69 | ||||
| 2026-02-13 | 13F | Centiva Capital, LP | 34.540 | 369 | ||||||
| 2026-02-09 | 13F | Themes Management Co LLC | 60.107 | 643 | ||||||
| 2026-02-17 | 13F | Price T Rowe Associates Inc /md/ | 125.175 | 67,18 | 1 | |||||
| 2026-02-13 | 13F | Charles Schwab Investment Management Inc | 125.420 | -0,02 | 1.341 | -14,27 | ||||
| 2026-02-05 | 13F | Cambridge Investment Research Advisors, Inc. | 13.485 | -17,90 | 0 | |||||
| 2026-02-17 | 13F | Point72 Asset Management, L.P. | Put | 145.800 | 1.559 | |||||
| 2025-11-12 | 13F/A | Norges Bank | 0 | -100,00 | 0 | |||||
| 2025-11-13 | 13F | Jaffetilchin Investment Partners, LLC | 0 | -100,00 | 0 | |||||
| 2026-02-17 | 13F | Point72 Asset Management, L.P. | Call | 60.300 | 645 | |||||
| 2026-02-17 | 13F | Point72 Asset Management, L.P. | 331.354 | 3.542 | ||||||
| 2026-02-13 | 13F | Panagora Asset Management Inc | 113.871 | 163,71 | 1.217 | 126,21 | ||||
| 2025-11-14 | 13F | Susquehanna Fundamental Investments, Llc | 0 | -100,00 | 0 | |||||
| 2026-02-17 | 13F | Trexquant Investment LP | 345.422 | 3.693 | ||||||
| 2026-02-17 | 13F | Jones Financial Companies Lllp | 4.471 | -8,96 | 48 | -18,97 | ||||
| 2026-02-12 | 13F | MetLife Investment Management, LLC | 23.191 | 12,26 | 248 | -3,89 | ||||
| 2026-01-29 | 13F | Cornerstone Investment Partners, LLC | 0 | -100,00 | 0 | |||||
| 2026-02-17 | 13F | Public Employees Retirement System Of Ohio | 1.505 | -11,00 | 16 | -23,81 | ||||
| 2026-02-04 | 13F | Atlantic Union Bankshares Corp | 75 | 0,00 | 1 | |||||
| 2026-01-21 | 13F | Sound Income Strategies, LLC | 60 | 1 | ||||||
| 2026-02-17 | 13F | Northern Trust Corp | 315.523 | -9,31 | 3.373 | -22,21 | ||||
| 2025-11-14 | 13F | Axa S.a. | 0 | -100,00 | 0 | |||||
| 2026-02-17 | 13F | Kemnay Advisory Services Inc. | 4.746 | 51 | ||||||
| 2026-02-11 | 13F | Winton Capital Group Ltd | 15.300 | 164 | ||||||
| 2026-02-12 | 13F | Voya Investment Management Llc | 162.408 | -26,92 | 1.736 | -37,28 | ||||
| 2026-02-17 | 13F | Bank Of America Corp /de/ | 138.834 | 112,77 | 1.484 | 82,53 | ||||
| 2026-02-17 | 13F | Advisor Group Holdings, Inc. | 11.042 | 10,02 | 118 | 8,26 | ||||
| 2026-02-09 | 13F | Hartland & Co., LLC | 3 | -98,28 | 0 | -100,00 | ||||
| 2026-02-18 | 13F | Mackenzie Financial Corp | 171.909 | 17,35 | 1.851 | 1,42 | ||||
| 2025-11-14 | 13F | Cubist Systematic Strategies, LLC | Put | 235.800 | -3,48 | 2.938 | 17,80 | |||
| 2025-11-14 | 13F | Cubist Systematic Strategies, LLC | Call | 85.100 | -2,52 | 1.060 | 18,97 | |||
| 2026-04-03 | 13F | Global Wealth Strategies & Associates | 12 | 0,00 | 0 | |||||
| 2026-03-12 | 13F | Nalls Sherbakoff Group, Llc | 0 | -100,00 | 0 | |||||
| 2026-02-17 | 13F | Numerai GP LLC | 34.686 | 112,34 | 371 | 82,27 | ||||
| 2026-01-26 | 13F | Asset Dedication, LLC | 521 | 0,00 | 6 | -16,67 | ||||
| 2026-01-27 | 13F | TD Waterhouse Canada Inc. | 2.318 | 0,00 | 25 | -17,24 | ||||
| 2026-02-12 | 13F | Paradigm Capital Management Inc/ny | 2.026.392 | -0,73 | 21.662 | -14,83 | ||||
| 2026-02-13 | 13F | First Trust Advisors Lp | 19.664 | 210 | ||||||
| 2026-02-17 | 13F | D. E. Shaw & Co., Inc. | Call | 0 | -100,00 | 0 | -100,00 | |||
| 2026-02-17 | 13F | Capstone Investment Advisors, Llc | 25.787 | 0,00 | 276 | -14,33 | ||||
| 2026-02-17 | 13F | Raymond James Financial Inc | 169.865 | 11,00 | 1.816 | -4,77 | ||||
| 2026-02-02 | 13F | Strs Ohio | 0 | -100,00 | 0 | |||||
| 2026-02-13 | 13F | MAI Capital Management | 122 | 0,00 | 1 | 0,00 | ||||
| 2025-11-14 | 13F | Walleye Capital LLC | 0 | -100,00 | 0 | -100,00 | ||||
| 2026-02-03 | 13F | Farmers & Merchants Investments Inc | 28 | 0,00 | 0 | |||||
| 2026-02-11 | 13F | Franklin Resources Inc | 98.783 | 21,10 | 1.056 | 3,84 | ||||
| 2026-02-17 | 13F | Prelude Capital Management, Llc | 0 | -100,00 | 0 | |||||
| 2026-02-17 | 13F | Cetera Investment Advisers | 18.609 | 14,09 | 199 | -2,46 | ||||
| 2026-01-29 | 13F | Concurrent Investment Advisors, LLC | 56.859 | -43,63 | 608 | -51,67 | ||||
| 2026-02-02 | 13F | Fifth Third Bancorp | 37 | -48,61 | 0 | |||||
| 2025-11-13 | 13F | Quinn Opportunity Partners LLC | 0 | -100,00 | 0 | |||||
| 2026-02-19 | 13F | Invesco Ltd. | 279.644 | 23,87 | 2.989 | 6,29 | ||||
| 2026-02-13 | 13F | Pinnacle Wealth Planning Services, Inc. | 656 | 7 | ||||||
| 2026-02-13 | 13F | Marshall Wace, Llp | 980.555 | 10.482 | ||||||
| 2026-02-17 | 13F | Algert Global Llc | 370.929 | 177,00 | 4 | 200,00 | ||||
| 2026-01-29 | 13F | Vanguard Group Inc | 3.350.626 | -3,13 | 35.818 | -16,89 | ||||
| 2026-02-06 | 13F | Larson Financial Group LLC | 6 | -92,00 | 0 | |||||
| 2026-02-13 | 13F | Walleye Capital LLC | Put | 6.300 | -78,42 | 67 | -81,54 | |||
| 2026-02-06 | 13F | FourThought Financial Partners, LLC | 0 | -100,00 | 0 | |||||
| 2025-11-14 | 13F | AXA Investment Managers S.A. | 12.044 | 150 | ||||||
| 2026-02-06 | 13F | Covestor Ltd | 4.001 | 55,68 | 0 | |||||
| 2026-02-17 | 13F | Two Sigma Investments, Lp | 908.353 | 13,12 | 9.710 | -2,95 | ||||
| 2025-11-04 | 13F | IMC-Chicago, LLC | 0 | -100,00 | 0 | -100,00 | ||||
| 2026-04-06 | 13F | Versant Capital Management, Inc | 27 | -18,18 | 0 | |||||
| 2026-01-21 | 13F | Rheos Capital Works Inc. | 600.000 | 0,00 | 6 | -14,29 | ||||
| 2026-02-11 | 13F | Nemes Rush Group LLC | Call | 300 | 0,00 | 0 | -100,00 | |||
| 2026-02-13 | 13F | American Century Companies Inc | 49.367 | 24,61 | 528 | 6,90 | ||||
| 2026-02-11 | 13F | CenterBook Partners LP | 0 | -100,00 | 0 | -100,00 | ||||
| 2026-02-11 | 13F | Ameritas Investment Partners, Inc. | 4.008 | 43 | ||||||
| 2026-02-13 | 13F | Altrafin AG | 0 | -100,00 | 0 | |||||
| 2026-01-30 | 13F | New York State Teachers Retirement System | 3.685 | 0 | ||||||
| 2026-02-17 | 13F | Optiver Holding B.V. | 166 | -55,14 | 2 | -75,00 | ||||
| 2025-11-19 | 13F | Caitong International Asset Management Co., Ltd | 0 | -100,00 | 0 | -100,00 | ||||
| 2026-02-13 | 13F | K2 Principal Fund, L.p. | 0 | -100,00 | 0 | -100,00 | ||||
| 2026-02-11 | 13F | Manchester Capital Management LLC | 0 | -100,00 | 0 | -100,00 | ||||
| 2026-02-12 | 13F | Federated Hermes, Inc. | 844.130 | 150,92 | 9.024 | 115,29 | ||||
| 2026-02-06 | 13F | EverSource Wealth Advisors, LLC | 149 | 0,00 | 2 | 0,00 | ||||
| 2026-04-13 | 13F | Salem Investment Counselors Inc | 705 | 4 | ||||||
| 2026-02-12 | 13F | Quadrant Capital Group Llc | 1.044 | -1,97 | 11 | -15,38 | ||||
| 2025-10-30 | 13F | Fairway Wealth LLC | 0 | -100,00 | 0 | |||||
| 2026-02-13 | 13F | Police & Firemen's Retirement System of New Jersey | 11.378 | 0,00 | 122 | -14,18 | ||||
| 2026-02-13 | 13F | Segall Bryant & Hamill, Llc | 81.130 | -0,88 | 867 | -14,92 | ||||
| 2026-02-11 | 13F | Group One Trading, L.p. | Put | 42.900 | -8,92 | 459 | -21,84 | |||
| 2026-02-17 | 13F | Two Sigma Advisers, Lp | 483.600 | 49,12 | 5.170 | 27,95 | ||||
| 2026-02-11 | 13F | Group One Trading, L.p. | 49.810 | -47,91 | 532 | -55,33 | ||||
| 2026-02-11 | 13F | Group One Trading, L.p. | Call | 79.300 | -45,42 | 848 | -53,20 | |||
| 2026-01-29 | 13F | Concord Wealth Partners | 62 | 0,00 | 1 | |||||
| 2026-02-13 | 13F | Wells Fargo & Company/mn | 80.019 | 23,84 | 855 | 6,21 | ||||
| 2026-02-17 | 13F | Sender Co & Partners, Inc. | Call | 0 | -100,00 | 0 | ||||
| 2026-02-12 | 13F | Integrated Quantitative Investments LLC | 0 | -100,00 | 0 | |||||
| 2026-02-13 | 13F | Caxton Associates Llp | 53.257 | 42,06 | 569 | 21,84 | ||||
| 2026-02-13 | 13F | Walleye Capital LLC | Call | 63.700 | -17,38 | 681 | -29,17 | |||
| 2026-02-10 | 13F | Rothschild Investment Llc | 150 | 0,00 | 2 | 0,00 | ||||
| 2026-02-13 | 13F | Rhumbline Advisers | 52.802 | -19,74 | 564 | -31,14 | ||||
| 2026-02-17 | 13F | Susquehanna Portfolio Strategies, LLC | 0 | -100,00 | 0 | -100,00 | ||||
| 2026-02-17 | 13F | American Capital Management Inc | 2.655.131 | -0,89 | 28.383 | -14,97 | ||||
| 2026-02-17 | 13F | Fmr Llc | 10.216 | 23,64 | 109 | 6,86 | ||||
| 2025-11-13 | 13F | FORA Capital, LLC | 0 | -100,00 | 0 | -100,00 | ||||
| 2026-02-11 | 13F | Simplex Trading, Llc | Put | 26.400 | -33,50 | 282 | ||||
| 2026-01-05 | 13F | Union Bancaire Privee, UBP SA | 0 | -100,00 | 0 | |||||
| 2026-02-11 | 13F | Simplex Trading, Llc | Call | 63.400 | -28,60 | 678 | 67.600,00 | |||
| 2026-02-13 | 13F | SRS Capital Advisors, Inc. | 223 | 63,97 | 2 | 100,00 | ||||
| 2026-02-05 | 13F | Amalgamated Bank | 1.272 | -7,56 | 0 | |||||
| 2026-01-16 | 13F | Crewe Advisors LLC | 1 | 0,00 | 0 | |||||
| 2026-02-10 | 13F/A | Northwestern Mutual Wealth Management Co | 62 | -43,12 | 1 | -100,00 | ||||
| 2026-04-08 | 13F | Community Financial Services Group, LLC | 1.270 | 9 | ||||||
| 2026-02-17 | 13F | Corsair Capital Management, L.p. | 0 | -100,00 | 0 | |||||
| 2026-02-17 | 13F | Ameriprise Financial Inc | 56.401 | 54,65 | 603 | 32,60 | ||||
| 2026-02-20 | 13F/A | Prestige Wealth Management Group LLC | 0 | -100,00 | 0 | |||||
| 2026-02-17 | 13F | Caption Management, LLC | 27.951 | 299 | ||||||
| 2025-11-14 | 13F | Walleye Trading LLC | 0 | -100,00 | 0 | -100,00 | ||||
| 2026-02-10 | 13F | Quantbot Technologies LP | 72.616 | -0,01 | 776 | -14,16 | ||||
| 2026-02-17 | 13F | Crawford Fund Management, LLC | Put | 304.000 | 23,08 | 3.250 | 5,59 | |||
| 2026-04-07 | 13F | Farther Finance Advisors, LLC | 959 | 26,18 | 6 | -25,00 | ||||
| 2026-04-08 | 13F | Wealth Enhancement Advisory Services, Llc | 30.529 | 105,14 | 221 | 23,46 | ||||
| 2026-01-29 | 13F | Comerica Bank | 47 | 51,61 | 1 | |||||
| 2026-02-09 | 13F | Harbour Investments, Inc. | 344 | 0,29 | 4 | -25,00 | ||||
| 2026-02-12 | 13F | Kovack Advisors, Inc. | 148.363 | 9,65 | 1.601 | -5,04 | ||||
| 2026-02-17 | 13F | Aquatic Capital Management LLC | 61.846 | 661 | ||||||
| 2026-02-11 | 13F | Jpmorgan Chase & Co | 32.086 | -74,50 | 343 | -78,19 | ||||
| 2026-02-17 | 13F | State Of Wisconsin Investment Board | 20.591 | 22,63 | 220 | 5,26 | ||||
| 2025-11-13 | 13F | Riggs Asset Managment Co. Inc. | 0 | -100,00 | 0 | |||||
| 2026-02-18 | 13F/A | Fuller & Thaler Asset Management, Inc. | 46.605 | -3,22 | 498 | -17,00 | ||||
| 2026-01-29 | 13F | UBS Group AG | 141.382 | -24,25 | 1.511 | -35,01 | ||||
| 2025-10-31 | 13F | Y-Intercept (Hong Kong) Ltd | 0 | -100,00 | 0 | |||||
| 2025-11-14 | 13F | Wolverine Trading, Llc | Put | 70.000 | 74,56 | 843 | 122,75 | |||
| 2025-11-14 | 13F | Squarepoint Ops LLC | Put | 0 | -100,00 | 0 | -100,00 | |||
| 2026-02-10 | 13F | Bnp Paribas Arbitrage, Sa | 9.735 | 10,20 | 104 | -5,45 | ||||
| 2026-02-17 | 13F | Citadel Advisors Llc | 891.869 | 151,69 | 9.534 | 115,95 | ||||
| 2026-02-17 | 13F | Citadel Advisors Llc | Call | 346.500 | -33,61 | 3.704 | -43,03 | |||
| 2026-02-17 | 13F | Canada Pension Plan Investment Board | 11.600 | 124 | ||||||
| 2025-11-14 | 13F | Squarepoint Ops LLC | Call | 0 | -100,00 | 0 | -100,00 | |||
| 2026-04-07 | 13F | CoreCap Advisors, LLC | 44 | 0,00 | 0 | |||||
| 2026-02-12 | 13F | Great Lakes Advisors, Llc | 10.057 | -6,83 | 108 | -20,15 | ||||
| 2026-02-02 | 13F | Wolverine Asset Management Llc | 5.015 | 54,69 | 54 | 32,50 | ||||
| 2025-11-14 | 13F | Wolverine Trading, Llc | 23.078 | -22,13 | 278 | -0,72 | ||||
| 2025-11-14 | 13F | Wolverine Trading, Llc | Call | 103.300 | 70,18 | 1.244 | 116,93 | |||
| 2026-02-17 | 13F | Susquehanna International Group, Llp | Call | 236.300 | 33,96 | 2.526 | 14,97 | |||
| 2026-02-13 | 13F | Cornerstone Financial Management LLC | 167 | 2 | ||||||
| 2026-02-13 | 13F | Headlands Technologies LLC | 19.074 | -50,40 | 204 | -57,62 | ||||
| 2026-02-17 | 13F | Susquehanna International Group, Llp | 49.292 | -68,42 | 527 | -72,94 | ||||
| 2026-02-13 | 13F | Golden State Wealth Management, LLC | 0 | -100,00 | 0 | |||||
| 2026-02-17 | 13F | Susquehanna International Group, Llp | Put | 204.900 | 81,97 | 2.190 | 56,21 | |||
| 2026-01-23 | 13F | Financial Connections Group, Inc. | 21 | 0,00 | 0 | |||||
| 2026-02-02 | 13F | Wolverine Asset Management Llc | Put | 29.200 | 0,00 | 312 | -14,05 | |||
| 2026-02-17 | 13F | Alliancebernstein L.p. | 34.310 | -26,23 | 367 | -36,79 | ||||
| 2026-02-26 | 13F | TD Capital Management LLC | 59 | 0,00 | 1 | |||||
| 2026-02-05 | 13F | Allworth Financial LP | 1.024 | -1,35 | 11 | -16,67 | ||||
| 2026-02-17 | 13F | Citadel Advisors Llc | Put | 380.600 | 20,63 | 4.069 | 3,49 | |||
| 2026-02-17 | 13F | Keebeck Alpha, LP | 0 | -100,00 | 0 | |||||
| 2026-02-12 | 13F | Renaissance Technologies Llc | 11.968 | 128 | ||||||
| 2026-02-17 | 13F | Atom Investors LP | 0 | -100,00 | 0 | |||||
| 2026-02-11 | 13F | Simplex Trading, Llc | 0 | -100,00 | 0 | |||||
| 2026-02-13 | 13F | Prudential Financial Inc | 63.434 | 678 | ||||||
| 2026-03-12 | 13F/A | Peak6 Llc | Call | 121.700 | 1.301 | |||||
| 2026-02-17 | 13F | Tower Research Capital LLC (TRC) | 7.642 | 375,84 | 82 | 305,00 | ||||
| 2026-02-17 | 13F | Brevan Howard Capital Management LP | 0 | -100,00 | 0 | -100,00 | ||||
| 2026-01-26 | 13F | Cwm, Llc | 18.769 | -1,25 | 0 | |||||
| 2026-02-13 | 13F | Pathstone Holdings, LLC | 0 | -100,00 | 0 | |||||
| 2025-10-20 | 13F | HighMark Wealth Management LLC | 0 | -100,00 | 0 | |||||
| 2026-02-06 | 13F | Pnc Financial Services Group, Inc. | 677 | -59,27 | 7 | -65,00 | ||||
| 2026-02-17 | 13F | PharVision Advisers, LLC | 18.186 | 194 | ||||||
| 2026-02-17 | 13F | Russell Investments Group, Ltd. | 118.652 | 8,15 | 1.268 | -7,17 | ||||
| 2026-01-15 | 13F | Nisa Investment Advisors, Llc | 6.901 | -12,09 | 74 | -24,74 | ||||
| 2026-02-12 | 13F | Steward Partners Investment Advisory, Llc | 9.696 | 0,00 | 104 | -14,17 | ||||
| 2026-02-12 | 13F | Grey Fox Wealth Advisors, LLC | 0 | -100,00 | 0 | |||||
| 2026-02-12 | 13F | Dimensional Fund Advisors Lp | 1.299.636 | 11,66 | 13.893 | -4,19 | ||||
| 2026-02-17 | 13F | California State Teachers Retirement System | 2.494 | -16,39 | 27 | -29,73 | ||||
| 2026-02-12 | 13F | Brinker Capital Investments, LLC | 11.971 | -5,35 | 128 | -19,11 | ||||
| 2026-02-13 | 13F | Quarry LP | 1.345 | 14 | ||||||
| 2026-04-13 | 13F | IFP Advisors, Inc | 183 | 6.000,00 | 1 | |||||
| 2025-11-10 | 13F | Rossby Financial, LCC | 0 | -100,00 | 0 | |||||
| 2026-02-06 | 13F | Addison Advisors LLC | 3 | 0,00 | 0 | |||||
| 2026-02-11 | 13F | Fox Run Management, L.l.c. | 33.336 | 8,04 | 356 | -7,29 | ||||
| 2025-11-14 | 13F | Strategic Wealth Partners, Ltd. | 0 | -100,00 | 0 | |||||
| 2025-11-17 | 13F | Sender Co & Partners, Inc. | 0 | -100,00 | 0 | -100,00 | ||||
| 2026-01-22 | 13F | Massachusetts Financial Services Co /ma/ | 207.609 | 2.219 | ||||||
| 2026-02-06 | 13F | Global Retirement Partners, LLC | 328 | -63,80 | 4 | -72,73 | ||||
| 2025-11-13 | 13F | Arrowstreet Capital, Limited Partnership | 0 | -100,00 | 0 | |||||
| 2026-02-03 | 13F | Acorn Financial Advisory Services Inc /adv | 110.973 | -1,07 | 1.186 | -15,10 | ||||
| 2026-02-17 | 13F | XTX Topco Ltd | 41.026 | 299,16 | 439 | 242,19 | ||||
| 2026-02-17 | 13F | Private Advisor Group, LLC | 20.520 | 219 | ||||||
| 2026-02-10 | 13F | Intech Investment Management Llc | 21.047 | -8,21 | 225 | -21,40 | ||||
| 2026-03-06 | 13F | Hsbc Holdings Plc | 19.221 | 1,55 | 205 | -10,48 | ||||
| 2026-02-11 | 13F | LPL Financial LLC | 47.448 | -27,64 | 507 | -37,94 | ||||
| 2026-02-10 | 13F | State of Wyoming | 21.426 | -16,93 | 229 | -28,66 | ||||
| 2026-02-13 | 13F | Integrated Wealth Concepts LLC | 0 | -100,00 | 0 | |||||
| 2026-02-13 | 13F | Financial Freedom, LLC | 2.708 | 0,00 | 29 | -15,15 | ||||
| 2026-02-17 | 13F | Quantinno Capital Management LP | 42.184 | 46,40 | 451 | 25,35 | ||||
| 2026-02-06 | 13F | Leonteq Securities AG | 10.715 | -7,17 | 115 | -20,28 | ||||
| 2026-02-17 | 13F | Hilltop Holdings Inc. | 12.000 | -63,96 | 128 | -69,08 | ||||
| 2026-01-20 | 13F | Family Legacy Financial Solutions, LLC | 0 | -100,00 | 0 | |||||
| 2026-03-04 | 13F | SHP Wealth Management | 867 | 9 | ||||||
| 2026-02-03 | 13F | SBI Securities Co., Ltd. | 4.373 | -15,37 | 47 | -28,12 | ||||
| 2026-02-05 | 13F | Navalign, LLC | 46 | 0 | ||||||
| 2026-02-13 | 13F | Virtus ETF Advisers LLC | 11.093 | 0,00 | 119 | -14,49 |
Other Listings
| DE:0S6 | €6,47 |