Statistik Dasar
| Pemilik Institusi | 297 total, 297 long only, 0 short only, 0 long/short - change of 1,36% MRQ |
| Alokasi Portofolio Rata-rata | 0.5612 % - change of -12,24% MRQ |
| Saham Institusi (Long) | 47.921.629 (ex 13D/G) - change of -3,21MM shares -6,28% MRQ |
| Nilai Institusi (Long) | $ 5.444.454 USD ($1000) |
Kepemilikan Institusi dan Pemegang Saham
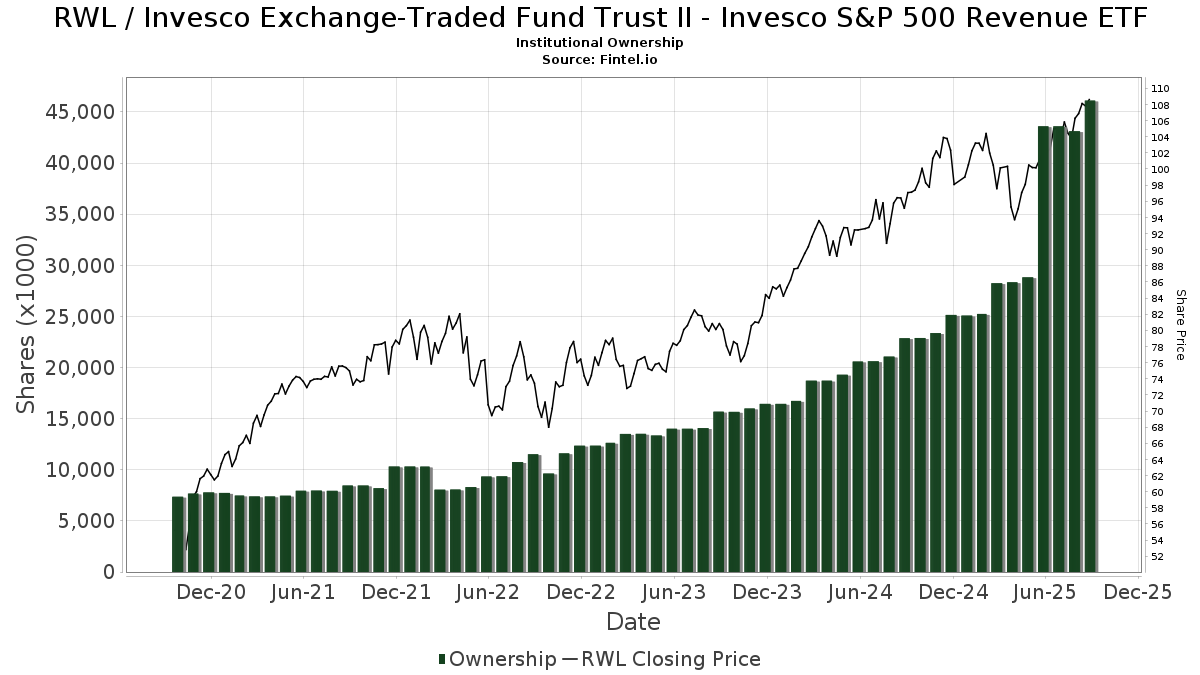
Invesco Exchange-Traded Fund Trust II - Invesco S&P 500 Revenue ETF (US:RWL) punya 297 pemilik institusi dan pemegang saham yang telah mengajukan formulir 13D/G atau 13F ke Securities Exchange Commission (SEC). Institusi-institusi ini memiliki total 47,921,629 saham. Pemegang saham terbesar termasuk Invesco Ltd., LPL Financial LLC, Ameriprise Financial Inc, Morgan Stanley, Vantagepoint Investment Advisers Llc, Bank Of America Corp /de/, Fusion Family Wealth LLC, Axxcess Wealth Management, Llc, Allworth Financial LP, and Advisor Group Holdings, Inc. .
Invesco Exchange-Traded Fund Trust II - Invesco S&P 500 Revenue ETF (ARCA:RWL) struktur kepemilikan institusi menunjukkan posisi saat ini di perusahaan menurut institusi dan dana, serta perubahan terkini dalam ukuran posisi. Pemegang saham utama dapat mencakup investor individu, reksa dana, hedge funds, atau institusi. Jadwal 13D menunjukkan bahwa investor memegang lebih dari 5% saham perusahaan dan bermaksud untuk secara aktif melakukan perubahan dalam strategi bisnis. Jadwal 13G menunjukkan investasi pasif lebih dari 5%.
The share price as of March 27, 2026 is 112,84 / share. Previously, on March 28, 2025, the share price was 98,43 / share. This represents an increase of 14,64% over that period.
Skor Sentimen Dana
Skor Sentimen Dana (Ownership Accumulation Score) menemukan saham-saham yang paling banyak dibeli oleh dana. Hal ini merupakan hasil dari model kuantitatif multifaktor yang canggih yang mengidentifikasi perusahaan-perusahaan dengan tingkat akumulasi institusi tertinggi. Model penilaian menggunakan kombinasi total peningkatan pemilik yang diungkapkan, perubahan alokasi portofolio pada pemilik tersebut, dan metrik lainnya. Angka tersebut berkisar dari 0 hingga 100, dengan angka yang lebih tinggi menunjukkan tingkat akumulasi yang lebih tinggi terhadap rekan-rekannya, dan 50 adalah rata-ratanya.
Frekuensi Pembaruan: Harian
Lihat Penjelajah Kepemilikan, yang menyediakan daftar perusahaan dengan peringkat tertinggi.
AI+ Ask Fintel’s AI assistant about Invesco Exchange-Traded Fund Trust II - Invesco S&P 500 Revenue ETF.
Select a question to share a public post with an AI-crafted answer.
Thinking of good questions…
Rasio Put/Call Institusi
Selain melaporkan masalah ekuitas dan utang standar, institusi dengan lebih dari 100MM aset yang dikelola juga harus mengungkapkan kepemilikan opsi put dan call mereka. Karena opsi put umumnya mengindikasikan sentimen negatif, dan opsi call mengindikasikan sentimen positif, kita dapat memahami sentimen institusional secara keseluruhan dengan memplot rasio opsi put terhadap opsi call. Grafik di sebelah kanan menggambarkan rasio put/call historis untuk instrumen ini.
Penggunaan Rasio Put/Call sebagai indikator sentimen investor mengatasi salah satu kelemahan utama dalam menggunakan total kepemilikan institusional, yaitu sejumlah besar aset yang dikelola diinvestasikan secara pasif untuk melacak indeks. Dana yang dikelola secara pasif biasanya tidak membeli opsi sehingga indikator rasio put/call lebih dekat melacak sentimen dana yang dikelola secara aktif.
Pengajuan 13D/G
Kami menyajikan pengajuan 13D/G secara terpisah dari pengajuan 13F karena perlakuan berbeda dari SEC. Pengajuan 13D/G dapat diajukan oleh kelompok investor (dengan satu investor terkemuka), sedangkan pengajuan 13F tidak bisa. Hal ini mengakibatkan situasi di mana seorang investor dapat mengajukan 13D/G yang melaporkan satu nilai untuk total saham (mewakili seluruh saham yang dimiliki oleh kelompok investor), namun kemudian mengajukan 13F yang melaporkan nilai yang berbeda untuk total saham (yang hanya mewakili kepemilikan mereka sendiri). Artinya, kepemilikan saham atas pengajuan 13D/G dan pengajuan 13F seringkali tidak dapat dibandingkan secara langsung sehingga kami menyajikannya secara terpisah.
Catatan: Mulai 16 Mei 2021, kami tidak lagi menampilkan pemilik yang belum mengajukan 13D/G dalam setahun terakhir. Sebelumnya, kami menunjukkan riwayat lengkap pengajuan 13D/G. Secara umum, entitas yang wajib mengajukan pengajuan 13D/G harus mengajukan setidaknya satu tahun sekali sebelum mengajukan penutupan pengajuan. Namun, dana kadang-kadang keluar dari posisi tanpa menyerahkan pengajuan penutupan (yaitu, dana tersebut ditutup) sehingga menampilkan riwayat lengkap kadang-kadang mengakibatkan kebingungan tentang kepemilikan saat ini. Untuk mencegah kebingungan, kini kami hanya menampilkan pemilik saat ini - yaitu - pemilik yang telah mengajukan permohonan dalam setahun terakhir.
Upgrade to unlock premium data.
| Tanggal Berkas | Formulir | Investor | Sebelumnya Saham |
Terbaru Saham |
Δ Saham (Persentase) |
Kepemilikan (Persentase) |
Δ Kepemilikan (Persentase) |
|
|---|---|---|---|---|---|---|---|---|
| 2025-05-09 | Invesco Ltd. | 6,148,126 | 7,845,673 | 27.61 | 14.80 | 16.54 |
Pengajuan 13F dan NPORT
Detail pengajuan 13F gratis. Detail pengajuan NP memerlukan keanggotaan premium. Baris hijau menunjukkan posisi baru. Baris merah menunjukkan posisi yang sudah ditutup. Klik tautannya ikon untuk melihat riwayat transaksi lengkap.
Upgrade
untuk membuka data premium dan mengekspor ke Excel ![]() .
.
| Tanggal Berkas | Sumber | Investor | Jenis | Harga Rata-rata (Perkiraan) |
Saham | Δ Saham (%) |
Dilaporkan Nilai ($1000) |
Δ Nilai (%) |
Alokasi Portofolio (%) |
|
|---|---|---|---|---|---|---|---|---|---|---|
| 2026-01-08 | 13F | Armstrong Advisory Group, Inc | 4.859 | 0,00 | 556 | 3,54 | ||||
| 2026-02-13 | 13F | Golden State Wealth Management, LLC | 18.416 | -15,56 | 2.109 | -12,64 | ||||
| 2026-01-20 | 13F | AdvisorNet Financial, Inc | 41.963 | 7,49 | 4.805 | 11,20 | ||||
| 2026-02-11 | 13F | Marks Group Wealth Management, Inc | 2.520 | 0,00 | 289 | 3,60 | ||||
| 2026-01-14 | 13F | Wealthcare Advisory Partners LLC | 91.371 | 34,45 | 10.462 | 39,11 | ||||
| 2026-02-12 | 13F | Renaissance Technologies Llc | 8.900 | -55,28 | 1.019 | -53,72 | ||||
| 2026-02-13 | 13F | Glen Eagle Advisors, LLC | 0 | -100,00 | 0 | |||||
| 2025-11-14 | 13F | Guardian Wealth Advisors, Llc / Nc | 0 | -100,00 | 0 | |||||
| 2026-02-10 | 13F | Avestar Capital, LLC | 51.990 | 1,08 | 5.953 | 4,59 | ||||
| 2026-01-22 | 13F | Financial Consulate, Inc | 15 | 2 | ||||||
| 2026-01-26 | 13F | Harbor Asset Planning, Inc. | 35.335 | 6,74 | 4.046 | 10,46 | ||||
| 2026-02-12 | 13F | Solano Wealth Investment Advisors LLC | 18.928 | -5,24 | 2.167 | -1,95 | ||||
| 2026-01-14 | 13F | Kmg Fiduciary Partners, Llc | 9.101 | 1,00 | 1.042 | 4,51 | ||||
| 2026-02-26 | 13F | TD Capital Management LLC | 103 | 0,98 | 12 | 0,00 | ||||
| 2026-01-08 | 13F | True Wealth Design, LLC | 0 | -100,00 | 0 | |||||
| 2026-02-04 | 13F | Colonial River Wealth Management, LLC | 102.998 | 4,88 | 11.793 | 8,52 | ||||
| 2026-02-17 | 13F | Mercer Global Advisors Inc /adv | 6.389 | -0,06 | 732 | 3,39 | ||||
| 2026-02-17 | 13F | Silvercrest Asset Management Group Llc | 3.047 | 0,00 | 349 | 3,26 | ||||
| 2026-02-17 | 13F | Ameriprise Financial Inc | 3.770.378 | 3,45 | 431.846 | 7,07 | ||||
| 2026-02-03 | 13F | AssuredPartners Investment Advisors, LLC | 30.714 | 422,26 | 3.517 | 440,92 | ||||
| 2026-02-13 | 13F | Kestra Advisory Services, LLC | 0 | -100,00 | 0 | |||||
| 2026-02-13 | 13F | MAI Capital Management | 562 | 8,91 | 64 | 12,28 | ||||
| 2026-02-10 | 13F | Hilltop Partners LLC | 2.704 | -0,95 | 310 | 2,32 | ||||
| 2026-02-17 | 13F | Wellington Management Group Llp | 0 | -100,00 | 0 | |||||
| 2026-02-12 | 13F | Mount Yale Investment Advisors, LLC | 29.368 | -8,50 | 3.363 | -5,32 | ||||
| 2026-02-17 | 13F | Ancora Advisors, LLC | 56.095 | 2,94 | 6.423 | 6,52 | ||||
| 2026-02-13 | 13F | Citigroup Inc | 15.919 | 3,20 | 1.823 | 6,80 | ||||
| 2026-01-29 | 13F | Huntleigh Advisors, Inc. | 2.136 | -50,00 | 245 | -48,31 | ||||
| 2026-01-09 | 13F | Marshall Financial Group LLC | 7.294 | -3,25 | 835 | 0,12 | ||||
| 2026-02-12 | 13F | Great Valley Advisor Group, Inc. | 13.199 | 1,87 | 1.511 | 5,44 | ||||
| 2026-02-12 | 13F | StoneX Group Inc. | 1.867 | 0,32 | 214 | 3,90 | ||||
| 2026-02-17 | 13F | Jones Financial Companies Lllp | 790.186 | 23,93 | 90.565 | 28,80 | ||||
| 2026-01-16 | 13F | Legacy Capital Wealth Partners, LLC | 72.517 | -3,76 | 7.630 | -1,05 | ||||
| 2026-02-19 | 13F | CI Private Wealth, LLC | 5.295 | 58,25 | 387 | 4,32 | ||||
| 2026-01-21 | 13F | Sound Income Strategies, LLC | 2.341 | 277 | ||||||
| 2026-01-23 | 13F | Assetmark, Inc | 475 | 11,24 | 54 | 14,89 | ||||
| 2026-02-02 | 13F | Retirement Planning Group, Llc / Ny | 70.323 | 14,94 | 8.052 | 18,92 | ||||
| 2026-02-06 | 13F | Vestmark Advisory Solutions, Inc. | 29.268 | -8,74 | 3.351 | -5,55 | ||||
| 2026-02-12 | 13F | CIBC Private Wealth Group, LLC | 104 | 0,00 | 12 | 0,00 | ||||
| 2026-02-06 | 13F | Empirical Asset Management, LLC | 11.817 | 0,19 | 1.353 | 3,68 | ||||
| 2026-01-26 | 13F | JNBA Financial Advisors | 0 | -100,00 | 0 | |||||
| 2026-01-13 | 13F | Cadent Capital Advisors, LLC | 128.726 | 0,65 | 14.739 | 4,15 | ||||
| 2026-02-17 | 13F | Mpwm Advisory Solutions, Llc | 0 | -100,00 | 0 | |||||
| 2026-02-13 | 13F | Jacobi Capital Management LLC | 2.259 | -1,61 | 259 | 1,57 | ||||
| 2026-02-17 | 13F | Integrity Wealth Advisors, Inc. | 18.303 | 2.096 | ||||||
| 2026-02-06 | 13F | Global Retirement Partners, LLC | 295.565 | 3,60 | 33.842 | 7,20 | ||||
| 2026-02-10 | 13F | Thoroughbred Financial Services, Llc | 205.753 | 38,64 | 24 | 43,75 | ||||
| 2026-01-23 | 13F | Aspect Partners, LLC | 2.652 | 0,00 | 304 | 3,41 | ||||
| 2026-02-17 | 13F | Evolve Private Wealth, Llc | 5.747 | 658 | ||||||
| 2026-02-10 | 13F | IFG Advisory, LLC | 1.861 | 213 | ||||||
| 2026-02-12 | 13F | Laurel Oak Wealth Management, Llc | 1.948 | 223 | ||||||
| 2026-02-17 | 13F | Bank Of America Corp /de/ | 2.189.385 | -0,19 | 250.685 | 3,27 | ||||
| 2026-01-16 | 13F | Aspire Capital Advisors LLC | 121.932 | 1,45 | 13.961 | 4,97 | ||||
| 2026-01-14 | 13F | Nova Wealth Management, Inc. | 5.608 | -6,46 | 642 | -3,17 | ||||
| 2026-02-12 | 13F | Brown Brothers Harriman & Co | 2.176 | 0,00 | 249 | 3,75 | ||||
| 2026-02-05 | 13F | Western Wealth Management, LLC | 66.907 | -1,20 | 7.661 | 2,23 | ||||
| 2026-02-10 | 13F | Cherry Tree Wealth Management, LLC | 340 | 0,00 | 39 | 2,70 | ||||
| 2026-02-13 | 13F | Integrated Wealth Concepts LLC | 20.258 | -40,93 | 2.320 | -38,89 | ||||
| 2026-02-09 | 13F | CBIZ Investment Advisory Services, LLC | 116 | 0,87 | 13 | 8,33 | ||||
| 2026-02-11 | 13F | Atlantic Private Wealth, LLC | 528 | 0,00 | 61 | 3,45 | ||||
| 2026-01-28 | 13F | N.E.W. Advisory Services LLC | 119 | 20,20 | 14 | 30,00 | ||||
| 2026-02-17 | 13F | Jump Financial, LLC | 2.960 | 339 | ||||||
| 2026-02-09 | 13F | Huntington National Bank | 207 | 3,50 | ||||||
| 2026-02-12 | 13F | Daybright Advisory Services, Inc. | 12.487 | 1.430 | ||||||
| 2026-02-19 | 13F | Mcguire Capital Advisors Inc | 22 | 3 | ||||||
| 2026-02-13 | 13F | Tcfg Wealth Management, Llc | 21.125 | -0,57 | 2.419 | 2,85 | ||||
| 2026-01-05 | 13F | GoalVest Advisory LLC | 223 | 355,10 | 26 | 400,00 | ||||
| 2026-02-09 | 13F | Harbour Investments, Inc. | 112.081 | -4,72 | 12.833 | -1,41 | ||||
| 2026-01-05 | 13F | GAMMA Investing LLC | 231 | 0,00 | 26 | 4,00 | ||||
| 2026-02-02 | 13F | Heritage Financial Services, LLC | 1.996 | 0,00 | 229 | 3,64 | ||||
| 2026-02-03 | 13F | Legacy Wealth Managment, LLC/ID | 70 | -48,15 | 8 | -42,86 | ||||
| 2026-02-10 | 13F | ESL Trust Services, LLC | 543 | 0,00 | 62 | 3,33 | ||||
| 2026-01-23 | 13F | Optima Capital Llc | 29.858 | 8,53 | 3.419 | 12,29 | ||||
| 2026-01-23 | 13F | Gilbert Capital Group, Inc. | 3.168 | 0,00 | 363 | 3,43 | ||||
| 2026-02-12 | 13F | Hm Payson & Co | 640 | 0,00 | 73 | 4,29 | ||||
| 2025-11-10 | 13F | Signature Securities Group Corporation | 0 | -100,00 | 0 | |||||
| 2025-11-14 | 13F | Strategic Wealth Partners, Ltd. | 4 | 0,00 | 0 | |||||
| 2026-02-04 | 13F | Money Concepts Capital Corp | 48.074 | 416,48 | 5.504 | 434,37 | ||||
| 2026-02-17 | 13F | Aqr Capital Management Llc | 20.921 | 3,72 | 2.395 | 7,30 | ||||
| 2026-01-23 | 13F | Meridian Financial, LLC | 17.439 | 92,36 | 1.997 | 99,00 | ||||
| 2026-01-26 | 13F | Nations Financial Group Inc, /ia/ /adv | 19.303 | -20,44 | 2.210 | -17,66 | ||||
| 2026-02-12 | 13F | BlackRock, Inc. | 278 | 0,00 | 32 | 3,33 | ||||
| 2026-02-11 | 13F | Rise Advisors, LLC | 0 | -100,00 | 0 | |||||
| 2026-02-03 | 13F | International Assets Investment Management, Llc | 157 | 18 | ||||||
| 2026-02-04 | 13F | Nwam Llc | 51.759 | 6,58 | 6.131 | 13,24 | ||||
| 2026-02-20 | 13F | Sunbelt Securities, Inc. | 30.801 | 21,49 | 3.527 | 25,70 | ||||
| 2026-02-02 | 13F | Oppenheimer & Co Inc | 2.140 | 0,23 | 245 | 3,81 | ||||
| 2026-01-30 | 13F | Simplicity Wealth,LLC | 19.708 | -1,08 | 2.257 | 2,36 | ||||
| 2026-02-10 | 13F | Essex Financial Services, Inc. | 38.198 | 5,83 | 4.374 | 9,49 | ||||
| 2026-01-23 | 13F | Farther Finance Advisors, LLC | 13.277 | 1,17 | 1.520 | 4,68 | ||||
| 2026-02-02 | 13F | Mutual Advisors, LLC | 3.500 | 0,00 | 401 | 2,30 | ||||
| 2026-02-04 | 13F | Fusion Family Wealth LLC | 1.628.324 | 2,95 | 186.443 | 6,53 | ||||
| 2025-10-27 | 13F | First Horizon Corp | 0 | -100,00 | 0 | |||||
| 2026-02-06 | 13F | Envestnet Portfolio Solutions, Inc. | 5.697 | 12,39 | 652 | 16,43 | ||||
| 2026-02-17 | 13F | Scarborough Advisors, LLC | 241.449 | 1,48 | 27.646 | 5,00 | ||||
| 2026-01-26 | 13F | Main Street Group, LTD | 2.887 | 1,33 | 331 | 4,76 | ||||
| 2026-01-21 | 13F | Landaas & Co /wi /adv | 4.863 | 20,34 | 557 | 24,38 | ||||
| 2025-11-05 | 13F | Collier Financial | 0 | -100,00 | 0 | |||||
| 2026-02-06 | 13F | HighTower Advisors, LLC | 6.649 | 2,26 | 761 | 5,84 | ||||
| 2026-01-09 | 13F | Atlas Brown,Inc. | 1.862 | 0,32 | 213 | 3,90 | ||||
| 2026-01-30 | 13F | Sigma Planning Corp | 3.766 | 12,45 | 431 | 16,49 | ||||
| 2026-02-17 | 13F | Gotham Asset Management, LLC | 3.800 | 0,00 | 435 | 3,57 | ||||
| 2026-02-03 | 13F | Anfield Capital Management, LLC | 170 | 0,00 | 19 | 5,56 | ||||
| 2026-02-10 | 13F | Ritter Daniher Financial Advisory LLC / DE | 3.379 | 25,47 | 387 | 29,53 | ||||
| 2026-02-10 | 13F | Redwood Financial Network Corp | 10.431 | 23,07 | 1.194 | 27,43 | ||||
| 2026-02-13 | 13F | SRS Capital Advisors, Inc. | 926 | -4,54 | 106 | -0,93 | ||||
| 2026-02-13 | 13F | Aptus Capital Advisors, LLC | 331 | 359,72 | 38 | 428,57 | ||||
| 2025-11-12 | 13F | Veridan Wealth LLC | 0 | -100,00 | 0 | |||||
| 2026-01-26 | 13F | AE Wealth Management LLC | 43.769 | 10,66 | 5.012 | 14,48 | ||||
| 2026-01-26 | 13F | United Advisor Group, LLC | 4.895 | 6,02 | 560 | 9,80 | ||||
| 2025-11-14 | 13F | Hrt Financial Lp | 0 | -100,00 | 0 | |||||
| 2026-01-23 | 13F | RFG - Bristol Wealth Advisors, LLC | 22.583 | -6,85 | 2.586 | -3,62 | ||||
| 2026-01-26 | 13F | Consolidated Portfolio Review Corp | 0 | -100,00 | 0 | |||||
| 2026-01-13 | 13F | Parsons Capital Management Inc/ri | 2.760 | 0,00 | 316 | 3,61 | ||||
| 2026-02-04 | 13F | MONECO Advisors, LLC | 83.759 | 5,43 | 9.590 | 9,09 | ||||
| 2026-02-11 | 13F | Gwn Securities Inc. | 3.064 | 33,45 | 351 | 37,25 | ||||
| 2026-01-12 | 13F | Wealth Management Partners, LLC | 47.752 | -6,84 | 5.468 | -3,61 | ||||
| 2026-02-11 | 13F | O'shaughnessy Asset Management, Llc | 210 | 0,00 | 24 | 4,35 | ||||
| 2026-01-29 | 13F | Nbc Securities, Inc. | 1.256 | 0,00 | 144 | 3,62 | ||||
| 2026-01-23 | 13F | Westside Investment Management, Inc. | 100 | 0,00 | 11 | 0,00 | ||||
| 2025-11-12 | 13F | Creekmur Asset Management LLC | 297 | 0,00 | 33 | 6,67 | ||||
| 2026-02-09 | 13F | Integrity Alliance, Llc. | 2.125 | 243 | ||||||
| 2026-01-29 | 13F | Resonant Capital Advisors, LLC | 71.003 | -1,25 | 8.130 | 2,17 | ||||
| 2026-02-02 | 13F | Total Clarity Wealth Management, Inc. | 76.279 | 65,34 | 8.734 | 71,07 | ||||
| 2026-02-11 | 13F | Empowered Funds, LLC | 0 | -100,00 | 0 | |||||
| 2026-01-14 | 13F | Thompson Investment Management, Inc. | 500 | 0,00 | 57 | 3,64 | ||||
| 2026-01-28 | 13F | Caliber Wealth Management, LLC / KS | 2.017 | 0,00 | 231 | 3,14 | ||||
| 2026-02-11 | 13F | Jpmorgan Chase & Co | 144.935 | 39,26 | 16.595 | 44,09 | ||||
| 2026-01-26 | 13F | Patriot Financial Group Insurance Agency, LLC | 6.629 | 9,61 | 759 | 13,30 | ||||
| 2026-02-11 | 13F | Buckingham Strategic Partners | 3.593 | 411 | ||||||
| 2026-01-29 | 13F | UMA Financial Services, Inc. | 9 | 0,00 | 1 | 0,00 | ||||
| 2026-02-13 | 13F | Retirement Financial Solutions, Llc | 50.751 | 7,22 | 5.811 | 10,92 | ||||
| 2026-02-13 | 13F | Arkadios Wealth Advisors | 2.868 | 1,13 | 328 | 4,79 | ||||
| 2026-02-17 | 13F | Raymond James Financial Inc | 894.401 | 18,30 | 102.409 | 22,41 | ||||
| 2026-01-28 | 13F | Geneos Wealth Management Inc. | 71.068 | 5,19 | 8.137 | 8,84 | ||||
| 2026-02-06 | 13F | Pnc Financial Services Group, Inc. | 760 | 17,83 | 87 | 22,54 | ||||
| 2026-02-10 | 13F | Operose Advisors LLC | 475 | 0,00 | 54 | 3,85 | ||||
| 2026-01-29 | 13F | Concurrent Investment Advisors, LLC | 32.725 | 63,75 | 3.747 | 69,43 | ||||
| 2026-02-09 | 13F | Kingsview Wealth Management, LLC | 17.981 | -17,59 | 2.059 | -14,75 | ||||
| 2026-02-10 | 13F/A | Northwestern Mutual Wealth Management Co | 276.526 | 9,18 | 31.662 | 12,97 | ||||
| 2026-02-10 | 13F | Savant Capital, LLC | 4.315 | 2,96 | 494 | 6,70 | ||||
| 2026-02-12 | 13F | Oder Investment Management, LLC | 2.572 | 15,96 | 294 | 20,00 | ||||
| 2026-01-20 | 13F | SOA Wealth Advisors, LLC. | 75 | 0,00 | 9 | 0,00 | ||||
| 2025-11-12 | 13F | Paradigm Financial Partners, Llc | 0 | -100,00 | 0 | |||||
| 2025-11-05 | 13F | Hantz Financial Services, Inc. | 0 | 0 | ||||||
| 2026-02-02 | 13F | Mission Hills Financial Advisory, LLC | 66.230 | 2,14 | 7.583 | 5,69 | ||||
| 2026-02-11 | 13F | LPL Financial LLC | 5.870.899 | 16,77 | 672.218 | 20,82 | ||||
| 2026-01-23 | 13F | Fifth Third Securities, Inc. | 14.981 | -0,25 | 1.715 | 3,25 | ||||
| 2026-01-15 | 13F | MOR Wealth Management, LLC | 5.746 | 658 | ||||||
| 2026-01-29 | 13F | Sanctuary Advisors, LLC | 174.688 | 484,20 | 20.002 | 504,63 | ||||
| 2026-02-10 | 13F | Oxford Wealth Group, LLC | 53.547 | 6.131 | ||||||
| 2026-02-17 | 13F | Blair William & Co/il | 1.117 | 0,00 | 128 | 3,25 | ||||
| 2026-02-10 | 13F | Root Financial Partners, LLC | 499 | -10,89 | 57 | -6,56 | ||||
| 2026-02-05 | 13F | Blue Water Asset Management | 142.675 | 16.336 | ||||||
| 2026-02-13 | 13F | Brown Advisory Inc | 3.211 | 368 | ||||||
| 2026-02-17 | 13F | D. E. Shaw & Co., Inc. | 0 | -100,00 | 0 | |||||
| 2026-02-12 | 13F | Steward Partners Investment Advisory, Llc | 64.211 | 427,36 | 7.352 | 445,81 | ||||
| 2026-02-05 | 13F | AlphaCore Capital LLC | 1.184 | 136 | ||||||
| 2026-02-05 | 13F | Thrivent Financial For Lutherans | 24.508 | 3 | ||||||
| 2026-01-26 | 13F | Cwm, Llc | 3.209 | 17,42 | 0 | |||||
| 2026-02-17 | 13F | Creative Planning | 8.580 | 3,49 | 982 | 7,09 | ||||
| 2026-02-06 | 13F | Tanglewood Legacy Advisors, LLC | 273.240 | 66.381,75 | 31.286 | 69.424,44 | ||||
| 2026-02-02 | 13F | Truist Financial Corp | 46.346 | 58,54 | 5.307 | 64,07 | ||||
| 2026-02-05 | 13F | Petix & Botte Co | 92.168 | 18,45 | 10.553 | 22,57 | ||||
| 2026-02-17 | 13F | Tower Research Capital LLC (TRC) | 0 | -100,00 | 0 | |||||
| 2026-01-15 | 13F | Founders Capital Management | 5 | 0,00 | 1 | |||||
| 2026-02-17 | 13F | Cetera Investment Advisers | 869.157 | 14,19 | 99.518 | 18,15 | ||||
| 2026-02-12 | 13F | Forge Financial Services LLC | 38.550 | -0,97 | 4.414 | 2,39 | ||||
| 2026-01-27 | 13F | Vantagepoint Investment Advisers Llc | 2.271.112 | 0,08 | 260.042 | 3,56 | ||||
| 2026-02-12 | 13F | Wedbush Securities Inc | 2.251 | 0 | ||||||
| 2026-02-12 | 13F | Commonwealth Equity Services, Llc | 759.448 | -0,54 | 86.957 | 103.419,05 | ||||
| 2026-02-17 | 13F | Private Advisor Group, LLC | 254.783 | 89,79 | 29.173 | 96,38 | ||||
| 2026-01-29 | 13F | Klingman & Associates, LLC | 302.357 | 5,89 | 34.620 | 9,56 | ||||
| 2026-02-12 | 13F | Bank Of Montreal /can/ | 2.665 | 0,00 | 305 | -94,35 | ||||
| 2025-11-12 | 13F | Ameriflex Group, Inc. | 0 | -100,00 | 0 | |||||
| 2026-02-06 | 13F | Larson Financial Group LLC | 30 | 0,00 | 3 | 0,00 | ||||
| 2026-02-12 | 13F | LWM Advisory Services, LLC | 12.298 | 2,63 | 1.408 | 6,18 | ||||
| 2026-02-17 | 13F | Russell Investments Group, Ltd. | 25 | 0,00 | 3 | 0,00 | ||||
| 2026-02-19 | 13F | Invesco Ltd. | 9.001.402 | -1,91 | 1.030.661 | 1,50 | ||||
| 2026-01-27 | 13F | Belpointe Asset Management LLC | 8.661 | 0,10 | 992 | 3,55 | ||||
| 2026-01-29 | 13F | Comerica Bank | 11.219 | 12,77 | 1.285 | 16,73 | ||||
| 2025-10-28 | 13F | Pinnacle Financial Partners Inc | 1.845 | 204 | ||||||
| 2025-10-16 | 13F | Lowe Wealth Advisors, LLC | 200 | -33,33 | 22 | -29,03 | ||||
| 2026-02-06 | 13F | Flaharty Asset Management, LLC | 5.350 | 0,11 | 613 | 3,55 | ||||
| 2026-01-20 | 13F | Stratos Wealth Partners, LTD. | 138.880 | 9,88 | 15.902 | 13,69 | ||||
| 2026-02-05 | 13F | Pacific Sun Financial Corp | 3.162 | 0,00 | 362 | 3,72 | ||||
| 2026-01-27 | 13F | TFR Capital, LLC. | 89.813 | 2,14 | 10.284 | 5,68 | ||||
| 2026-01-07 | 13F | Baldwin Brothers Inc/ma | 6.600 | 0,00 | 756 | 3,42 | ||||
| 2026-02-13 | 13F | Manufacturers Life Insurance Company, The | 34.095 | 3.904 | ||||||
| 2026-02-13 | 13F | Wells Fargo & Company/mn | 774.689 | 9,30 | 88.702 | 13,09 | ||||
| 2026-02-10 | 13F | Goldman Sachs Group Inc | 172.427 | 16,96 | 19.743 | 21,02 | ||||
| 2026-02-13 | 13F | Y-Intercept (Hong Kong) Ltd | 0 | -100,00 | 0 | |||||
| 2026-01-08 | 13F | Tompkins Financial Corp | 40.122 | -0,18 | 4.594 | 3,26 | ||||
| 2026-01-22 | 13F | Glass Jacobson Investment Advisors llc | 1.232 | -7,78 | 141 | -4,08 | ||||
| 2026-01-26 | 13F | Wealth Effects Llc | 2.025 | 0,00 | 232 | 3,13 | ||||
| 2026-02-09 | 13F | Key FInancial Inc | 7.135 | -6,27 | 817 | -3,20 | ||||
| 2026-02-13 | 13F | Mml Investors Services, Llc | 191.618 | 8,29 | 21.940 | 12,05 | ||||
| 2026-01-12 | 13F | CVA Family Office, LLC | 0 | -100,00 | 0 | |||||
| 2026-01-28 | 13F | Kingswood Wealth Advisors, Llc | 60.456 | -4,42 | 6.922 | -1,10 | ||||
| 2026-01-22 | 13F | Bartlett & Co. Wealth Management Llc | 574 | 0,00 | 66 | 3,17 | ||||
| 2026-02-17 | 13F | IHT Wealth Management, LLC | 25.104 | 13,17 | 2.874 | 17,11 | ||||
| 2026-01-26 | 13F | Kelman-Lazarov, Inc. | 32.654 | -1,38 | 3.739 | 2,05 | ||||
| 2025-10-09 | 13F | Fermata Advisors, LLC | 0 | -100,00 | 0 | |||||
| 2026-02-05 | 13F | Pinnacle Associates Ltd | 2.380 | 0,00 | 273 | 3,42 | ||||
| 2026-01-29 | 13F | Atlas Legacy Advisors, LLC | 182.893 | 13,81 | 20.941 | 17,77 | ||||
| 2026-01-15 | 13F | Stewardship Advisors, LLC | 312.547 | 42,10 | 35.787 | 47,04 | ||||
| 2026-01-29 | 13F | DecisionPoint Financial, LLC | 12 | 1 | ||||||
| 2026-01-22 | 13F | Rodgers & Associates, LTD | 22.199 | -1,88 | 2.542 | 1,52 | ||||
| 2026-02-13 | 13F | Stifel Financial Corp | 63.148 | -10,82 | 7.231 | -7,73 | ||||
| 2026-01-20 | 13F | Pflug Koory, LLC | 1.560 | 0,06 | 179 | 3,49 | ||||
| 2026-01-21 | 13F | Future Financial Wealth Managment LLC | 0 | -100,00 | 0 | |||||
| 2026-01-20 | 13F | Investment Planning Advisors, Inc. | 165.859 | 2,53 | 18.991 | 6,08 | ||||
| 2026-01-28 | 13F | Cora Capital Advisors Llc | 4.522 | 0,00 | 518 | 3,40 | ||||
| 2026-02-17 | 13F | Snowden Capital Advisors LLC | 8.516 | 2,99 | 975 | 6,56 | ||||
| 2026-01-12 | 13F | Abound Wealth Management | 380 | 0,00 | 44 | 2,38 | ||||
| 2026-02-11 | 13F | J.w. Cole Advisors, Inc. | 11.793 | 5,23 | 1.337 | 7,82 | ||||
| 2026-01-20 | 13F | Sovran Advisors, LLC | 1.902 | -9,21 | 226 | -3,43 | ||||
| 2026-02-03 | 13F | Financial Partners Group, Inc | 3.351 | -2,53 | 395 | 3,95 | ||||
| 2026-02-12 | 13F | Beacon Capital Management, Inc. | 0 | -100,00 | 0 | |||||
| 2026-02-17 | 13F | Susquehanna International Group, Llp | 4.915 | -41,25 | 563 | -39,24 | ||||
| 2026-02-06 | 13F | Tortoise Investment Management, LLC | 0 | -100,00 | 0 | |||||
| 2026-02-06 | 13F | Signature Estate & Investment Advisors Llc | 2.836 | -21,57 | 325 | -19,00 | ||||
| 2026-01-14 | 13F | Kraft, Davis & Associates, LLC | 98.730 | 6,74 | 11.640 | 13,04 | ||||
| 2026-01-21 | 13F | Lockerman Financial Group, Inc. | 2.624 | 0,08 | 300 | 3,45 | ||||
| 2026-01-29 | 13F | Kestra Private Wealth Services, Llc | 71.472 | -7,82 | 8.184 | -4,63 | ||||
| 2026-02-05 | 13F | Intrua Financial, LLC | 44.022 | -4,91 | 5.041 | -1,62 | ||||
| 2026-01-20 | 13F | Thurston, Springer, Miller, Herd & Titak, Inc. | 1.394 | 160 | ||||||
| 2026-02-06 | 13F | Gsa Capital Partners Llp | 0 | -100,00 | 0 | |||||
| 2026-02-17 | 13F | Citadel Advisors Llc | 0 | -100,00 | 0 | |||||
| 2026-01-30 | 13F | Turning Point Benefit Group, Inc. | 1.259 | -3,08 | 144 | 0,70 | ||||
| 2026-02-05 | 13F | Atria Investments Llc | 15.846 | 175,10 | 1.814 | 184,77 | ||||
| 2026-02-11 | 13F | Fiera Capital Corp | 10.158 | 0,00 | 1.163 | 3,47 | ||||
| 2026-02-10 | 13F | Bank of New York Mellon Corp | 985.133 | 11,13 | 112.798 | 14,99 | ||||
| 2026-02-12 | 13F | Rik Saylor Financial, Inc. | 16.696 | 11,63 | 1.912 | 15,54 | ||||
| 2026-01-14 | 13F | Accurate Wealth Management, LLC | 5.245 | 0,00 | 619 | 6,91 | ||||
| 2026-02-13 | 13F | Baird Financial Group, Inc. | 6.344 | -31,02 | 726 | -28,61 | ||||
| 2026-02-13 | 13F | Perryman Financial Advisory Inc /ad | 2.737 | 313 | ||||||
| 2026-02-10 | 13F | SCS Capital Management LLC | 3.111 | 0,00 | 356 | 3,49 | ||||
| 2026-02-17 | 13F | Advisor Group Holdings, Inc. | 1.201.452 | -1,26 | 137.595 | 3,99 | ||||
| 2026-02-17 | 13F | Fmr Llc | 13.828 | 12,06 | 1.583 | 15,97 | ||||
| 2026-02-17 | 13F | Perennial Investment Advisors, LLC | 42.342 | 1,69 | 4.849 | 5,23 | ||||
| 2026-01-28 | 13F | Key Client Fiduciary Advisors, LLC | 20.890 | 3,12 | 2.392 | 6,69 | ||||
| 2026-01-26 | 13F | Lowery Thomas, Llc | 1.849 | 0,33 | 212 | 3,94 | ||||
| 2026-02-11 | 13F | Janney Montgomery Scott LLC | 24.363 | 3,06 | 3 | 0,00 | ||||
| 2026-02-13 | 13F | Morgan Stanley | 3.154.989 | 2,37 | 361.246 | 5,92 | ||||
| 2026-01-15 | 13F | Retireful, LLC | 3.107 | 356 | ||||||
| 2026-02-17 | 13F | Pennington Partners & Co., Llc | 4.686 | 0,09 | 537 | 3,47 | ||||
| 2026-01-08 | 13F | Wealth Enhancement Advisory Services, Llc | 93.115 | -4,25 | 10.935 | 1,14 | ||||
| 2026-02-03 | 13F | Marmo Financial Group, LLC | 1.868 | 0,05 | 214 | 3,40 | ||||
| 2026-02-12 | 13F | Brinker Capital Investments, LLC | 2.802 | 14,41 | 321 | 18,08 | ||||
| 2026-02-04 | 13F | Ameritas Advisory Services, LLC | 0 | -100,00 | 0 | |||||
| 2026-02-09 | 13F | Prospera Financial Services Inc | 16.612 | 10,43 | 1.903 | 14,23 | ||||
| 2026-01-23 | 13F | Diligent Investors, LLC | 3.052 | -1,13 | 349 | 2,35 | ||||
| 2026-02-17 | 13F | Garden State Investment Advisory Services LLC | 54.804 | 231,10 | 6.277 | 242,58 | ||||
| 2026-01-13 | 13F | LongView Wealth Management | 1.700 | 201 | ||||||
| 2026-01-23 | 13F | Avion Wealth | 771 | 0 | ||||||
| 2026-02-12 | 13F | Atlantic Family Wealth, Llc | 2.872 | 0,00 | 329 | 3,47 | ||||
| 2026-01-26 | 13F | BCS Wealth Management | 2.418 | 277 | ||||||
| 2026-02-23 | 13F | Sonoma Allocations LLC | 102.737 | 9,59 | 12.179 | 18,38 | ||||
| 2026-01-20 | 13F | Secure Asset Management, LLC | 9.451 | 7,30 | 1.082 | 10,97 | ||||
| 2026-02-11 | 13F | Parallel Advisors, LLC | 36 | 0,00 | 4 | 33,33 | ||||
| 2026-01-12 | 13F | DAVENPORT & Co LLC | 1.781 | 204 | ||||||
| 2026-01-29 | 13F | UBS Group AG | 541.369 | 11,24 | 61.987 | 15,10 | ||||
| 2026-01-23 | 13F | E&G Advisors, LP | 18.483 | 3,38 | 2.116 | 6,98 | ||||
| 2026-02-05 | 13F | High Note Wealth, LLC | 14 | 0,00 | 2 | 0,00 | ||||
| 2026-01-22 | 13F | Pinnacle Bancorp, Inc. | 488 | 0,00 | 56 | 1,85 | ||||
| 2026-01-29 | 13F | Aprio Wealth Management, LLC | 3.265 | 374 | ||||||
| 2026-02-06 | 13F | Fortis Group Advisors, LLC | 14.250 | 47,04 | 1.681 | 55,12 | ||||
| 2026-01-12 | 13F | Amplius Wealth Advisors, LLC | 11.651 | -9,22 | 1.334 | -6,06 | ||||
| 2026-02-11 | 13F | Ameritas Investment Partners, Inc. | 1.312 | 150 | ||||||
| 2026-02-13 | 13F | Cozad Asset Management Inc | 6.276 | 0,06 | 719 | 3,46 | ||||
| 2026-01-15 | 13F | Brookstone Capital Management | 113.951 | -13,66 | 13.047 | -10,66 | ||||
| 2026-01-26 | 13F | Private Trust Co Na | 3.517 | 6,16 | 403 | 9,84 | ||||
| 2025-11-14 | 13F | Jane Street Group, Llc | 0 | -100,00 | 0 | |||||
| 2026-01-14 | 13F | Wolff Wiese Magana Llc | 130 | -13,33 | 15 | -12,50 | ||||
| 2026-02-18 | 13F | GWM Advisors LLC | 36.230 | 104,14 | 4.148 | 111,20 | ||||
| 2026-01-28 | 13F | Glassman Wealth Services | 745 | 0,00 | 85 | 3,66 | ||||
| 2026-01-21 | 13F | Prime Capital Investment Advisors, LLC | 70.648 | 3,32 | 8.089 | 6,91 | ||||
| 2026-02-12 | 13F | SWAN Capital LLC | 258 | 30 | ||||||
| 2026-02-06 | 13F | GPS Wealth Strategies Group, LLC | 0 | -100,00 | 0 | |||||
| 2026-01-08 | 13F | Firethorn Wealth Partners, Llc | 13.885 | 1.590 | ||||||
| 2026-01-26 | 13F | Merit Financial Group, LLC | 175.248 | 4,26 | 20.066 | 7,88 | ||||
| 2026-02-17 | 13F | Wiley Bros.-aintree Capital, Llc | 18.235 | -16,62 | 2.088 | -13,72 | ||||
| 2026-01-07 | 13F | Harbor Investment Advisory, Llc | 521 | 0,00 | 60 | 3,51 | ||||
| 2026-02-10 | 13F | Bnp Paribas Arbitrage, Sa | 75.000 | 8.588 | ||||||
| 2026-01-21 | 13F | Capital Investment Advisory Services, LLC | 229 | 26 | ||||||
| 2026-02-05 | 13F | Bessemer Group Inc | 0 | -100,00 | 0 | |||||
| 2026-02-13 | 13F | Greenline Wealth Management LLC | 15 | 2 | ||||||
| 2026-02-06 | 13F | EverSource Wealth Advisors, LLC | 156.019 | 0,48 | 17.864 | 3,96 | ||||
| 2026-02-17 | 13F | Integrated Advisors Network LLC | 2.688 | 308 | ||||||
| 2026-02-13 | 13F | Colony Group, LLC | 36.371 | -5,39 | 4.165 | -2,12 | ||||
| 2026-02-11 | 13F | Capital Analysts, Inc. | 1.491 | 397,00 | 0 | |||||
| 2026-02-10 | 13F | Florida Financial Advisors, Llc | 2.258 | 258 | ||||||
| 2026-02-04 | 13F | Summit Wealth Group Llc / Co | 0 | -100,00 | 0 | -100,00 | ||||
| 2026-01-12 | 13F | Kozak & Associates, Inc. | 575.024 | 0,77 | 67.887 | 7,17 | ||||
| 2026-02-06 | 13F | Ignite Planners, LLC | 33.142 | 52,76 | 3.909 | 62,83 | ||||
| 2026-02-09 | 13F | Hartland & Co., LLC | 1.866 | 0,00 | 214 | 3,40 | ||||
| 2026-02-12 | 13F | Kovack Advisors, Inc. | 6.134 | 45,05 | 686 | 46,68 | ||||
| 2026-01-09 | 13F | Dynamic Advisor Solutions LLC | 10.775 | 0,97 | 1.234 | 4,49 | ||||
| 2026-02-13 | 13F | Level Four Advisory Services, Llc | 9.970 | -1,34 | 1.142 | 2,06 | ||||
| 2026-01-29 | 13F | Obermeyer Wood Investment Counsel, Lllp | 7.362 | 0,00 | 843 | 3,44 | ||||
| 2026-02-13 | 13F | Asset Allocation Strategies LLC | 235.917 | 69,81 | 27.012 | 75,70 | ||||
| 2026-02-17 | 13F | Equitable Holdings, Inc. | 352.645 | 12,99 | 40.378 | 16,91 | ||||
| 2026-01-13 | 13F | Capital Investment Advisors, LLC | 2.216 | 0,18 | 254 | 3,69 | ||||
| 2026-02-02 | 13F | Fifth Third Bancorp | 0 | -100,00 | 0 | |||||
| 2026-02-09 | 13F | Keating Financial Advisory Services, Inc. | 10.243 | 1.173 | ||||||
| 2026-02-02 | 13F | Holistic Planning, LLC | 12.414 | -2,60 | 1.421 | 0,78 | ||||
| 2026-01-12 | 13F | RVW Wealth, LLC | 43.443 | -1,34 | 4.974 | 2,09 | ||||
| 2026-02-05 | 13F | USAdvisors Wealth Management, LLC | 2.470 | 0 | ||||||
| 2026-01-16 | 13F | Crowley Wealth Management, Inc. | 0 | -100,00 | 0 | |||||
| 2026-02-03 | 13F | RFG Advisory, LLC | 3.381 | 15,71 | 387 | 19,81 | ||||
| 2026-02-06 | 13F | Axxcess Wealth Management, Llc | 1.338.780 | 1.242,08 | 153.290 | 1.288,75 | ||||
| 2026-02-17 | 13F | Advisory Services Network, LLC | 5.002 | -1,61 | 573 | 1,78 | ||||
| 2026-02-17 | 13F | Royal Bank Of Canada | 138.185 | -22,59 | 15.822 | -19,91 | ||||
| 2026-01-30 | 13F/A | M&t Bank Corp | 2.002 | -17,65 | 229 | -14,87 | ||||
| 2026-02-13 | 13F | Mariner, LLC | 202.955 | 1,18 | 23.238 | 4,69 | ||||
| 2026-02-14 | 13F | Rockefeller Capital Management L.P. | 44.615 | 1,30 | 5.108 | 4,82 | ||||
| 2026-02-12 | 13F | Mark Sheptoff Financial Planning, Llc | 341 | 0,00 | 39 | 5,41 | ||||
| 2026-01-22 | 13F | Apollon Wealth Management, LLC | 4.052 | -43,67 | 464 | -41,76 | ||||
| 2026-02-04 | 13F | Pensionmark Financial Group, Llc | 37.716 | -12,76 | 4.319 | -9,72 | ||||
| 2026-02-10 | 13F | Acorn Wealth Advisors, LLC | 10.326 | 7,09 | 1.182 | 10,88 | ||||
| 2026-02-19 | 13F | Michels Family Financial, LLC | 0 | -100,00 | 0 | |||||
| 2025-11-13 | 13F | Visionary Wealth Advisors | 0 | -100,00 | 0 | -100,00 | ||||
| 2026-01-30 | 13F | Us Bancorp \de\ | 1.191 | 5,87 | 136 | 9,68 | ||||
| 2026-02-05 | 13F | Stephens Inc /ar/ | 2.232 | 4,40 | 256 | 8,05 | ||||
| 2026-02-10 | 13F | Envestnet Asset Management Inc | 157.762 | 20,72 | 18.064 | 24,91 | ||||
| 2026-02-06 | 13F | IFP Advisors, Inc | 35 | 0,00 | 4 | 33,33 | ||||
| 2026-02-12 | 13F | Principal Securities, Inc. | 3.487 | 8,87 | 399 | 12,71 | ||||
| 2026-01-30 | 13F | Archer Investment Corp | 262 | -1,87 | 30 | 0,00 | ||||
| 2026-02-12 | 13F | Grey Fox Wealth Advisors, LLC | 0 | -100,00 | 0 | |||||
| 2026-02-05 | 13F | Allworth Financial LP | 1.261.650 | -44,78 | 144.459 | -42,86 | ||||
| 2026-02-13 | 13F | Denver Wealth Management, Inc. | 159.604 | 3,52 | 18.275 | 7,11 | ||||
| 2026-02-12 | 13F | Absolute Capital Management, LLC | 0 | -100,00 | 0 | |||||
| 2026-02-27 | 13F | OakTrust Wealth Advisors, LLC | 1.924 | 220 | ||||||
| 2026-02-26 | 13F | Anchor Investment Management, LLC | 0 | -100,00 | 0 | |||||
| 2026-02-05 | 13F | Cambridge Investment Research Advisors, Inc. | 130.664 | 40,66 | 15 | 40,00 | ||||
| 2026-02-11 | 13F | Cerity Partners LLC | 383.757 | -0,96 | 43.940 | 2,47 | ||||
| 2026-02-17 | 13F | Qube Research & Technologies Ltd | 23.217 | 47,19 | 2.658 | 52,32 |