Statistik Dasar
| Pemilik Institusi | 484 total, 482 long only, 0 short only, 2 long/short - change of 8,99% MRQ |
| Alokasi Portofolio Rata-rata | 0.1188 % - change of 7,41% MRQ |
| Saham Beredar | shares (source: Capital IQ) |
| Saham Institusi (Long) | 79.086.113 - 80,75% (ex 13D/G) - change of -2,32MM shares -2,84% MRQ |
| Nilai Institusi (Long) | $ 7.280.872 USD ($1000) |
Kepemilikan Institusi dan Pemegang Saham
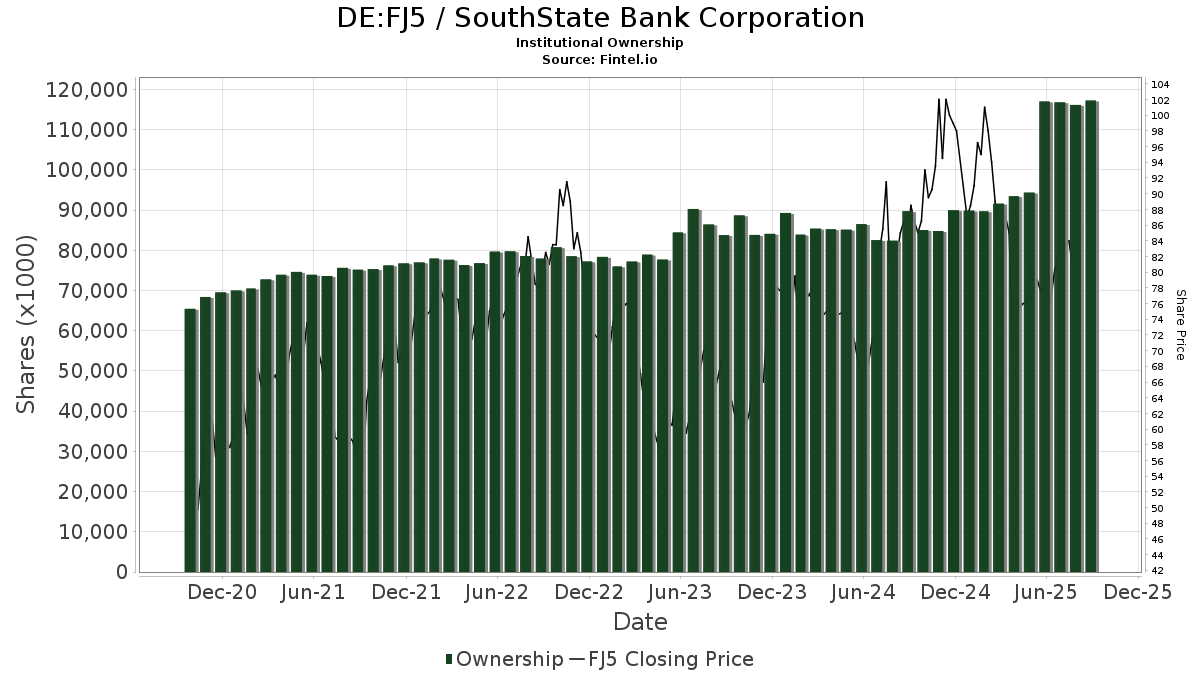
SouthState Bank Corporation (DE:FJ5) punya 484 pemilik institusi dan pemegang saham yang telah mengajukan formulir 13D/G atau 13F ke Securities Exchange Commission (SEC). Institusi-institusi ini memiliki total 79,086,113 saham. Pemegang saham terbesar termasuk Vanguard Group Inc, BlackRock, Inc., Dimensional Fund Advisors Lp, State Street Corp, Geode Capital Management, Llc, American Century Companies Inc, Victory Capital Management Inc, Invesco Ltd., Fmr Llc, and Franklin Resources Inc .
SouthState Bank Corporation (DB:FJ5) struktur kepemilikan institusi menunjukkan posisi saat ini di perusahaan menurut institusi dan dana, serta perubahan terkini dalam ukuran posisi. Pemegang saham utama dapat mencakup investor individu, reksa dana, hedge funds, atau institusi. Jadwal 13D menunjukkan bahwa investor memegang lebih dari 5% saham perusahaan dan bermaksud untuk secara aktif melakukan perubahan dalam strategi bisnis. Jadwal 13G menunjukkan investasi pasif lebih dari 5%.
The share price as of September 1, 2025 is 86,00 / share. Previously, on April 28, 2025, the share price was 75,50 / share. This represents an increase of 13,91% over that period.
Skor Sentimen Dana
Skor Sentimen Dana (Ownership Accumulation Score) menemukan saham-saham yang paling banyak dibeli oleh dana. Hal ini merupakan hasil dari model kuantitatif multifaktor yang canggih yang mengidentifikasi perusahaan-perusahaan dengan tingkat akumulasi institusi tertinggi. Model penilaian menggunakan kombinasi total peningkatan pemilik yang diungkapkan, perubahan alokasi portofolio pada pemilik tersebut, dan metrik lainnya. Angka tersebut berkisar dari 0 hingga 100, dengan angka yang lebih tinggi menunjukkan tingkat akumulasi yang lebih tinggi terhadap rekan-rekannya, dan 50 adalah rata-ratanya.
Frekuensi Pembaruan: Harian
Lihat Penjelajah Kepemilikan, yang menyediakan daftar perusahaan dengan peringkat tertinggi.
AI+ Ask Fintel’s AI assistant about SouthState Bank Corporation.
Select a question to share a public post with an AI-crafted answer.
Thinking of good questions…
Pengajuan 13F dan NPORT
Detail pengajuan 13F gratis. Detail pengajuan NP memerlukan keanggotaan premium. Baris hijau menunjukkan posisi baru. Baris merah menunjukkan posisi yang sudah ditutup. Klik tautannya ikon untuk melihat riwayat transaksi lengkap.
Upgrade
untuk membuka data premium dan mengekspor ke Excel ![]() .
.
| Tanggal Berkas | Sumber | Investor | Jenis | Harga Rata-rata (Perkiraan) |
Saham | Δ Saham (%) |
Dilaporkan Nilai ($1000) |
Δ Nilai (%) |
Alokasi Portofolio (%) |
|
|---|---|---|---|---|---|---|---|---|---|---|
| 2025-11-12 | 13F | Simplex Trading, Llc | Put | 0 | -100,00 | 0 | ||||
| 2026-04-14 | 13F | Moisand Fitzgerald Tamayo, LLC | 2.174 | 0,00 | 201 | -1,47 | ||||
| 2026-02-03 | 13F | SBI Securities Co., Ltd. | 6 | 0,00 | 1 | |||||
| 2025-11-12 | 13F | Simplex Trading, Llc | Call | 0 | -100,00 | 0 | ||||
| 2026-02-05 | 13F | New York Life Investment Management Llc | 8.857 | 834 | ||||||
| 2026-04-17 | 13F | Bell Investment Advisors, Inc | 50 | 13,64 | 5 | 0,00 | ||||
| 2026-04-08 | 13F | Wealth Enhancement Advisory Services, Llc | 33.368 | -7,80 | 3.134 | -10,84 | ||||
| 2026-02-09 | 13F | Legal & General Group Plc | 148.006 | -7,29 | 13.929 | -11,76 | ||||
| 2026-02-10 | 13F | Meitav Dash Investments Ltd | 2.795 | 263 | ||||||
| 2026-02-12 | 13F | Campbell & CO Investment Adviser LLC | 17.121 | 45,65 | 1.611 | 38,64 | ||||
| 2026-04-22 | 13F | Caldwell Trust Co | 621 | 0,00 | 57 | -1,72 | ||||
| 2026-01-20 | 13F | Savvy Advisors, Inc. | 0 | -100,00 | 0 | |||||
| 2026-02-13 | 13F | Martin & Co Inc /tn/ | 39.113 | 2,81 | 3.681 | -2,15 | ||||
| 2026-03-06 | 13F | Hsbc Holdings Plc | 36.799 | -68,48 | 3.465 | -69,72 | ||||
| 2026-02-13 | 13F | Acumen Wealth Advisors, LLC | 30 | 3 | ||||||
| 2026-02-17 | 13F | Quantinno Capital Management LP | 62.126 | 5.847 | ||||||
| 2026-02-04 | 13F | Biltmore Family Office, LLC | 2.336 | 0,00 | 220 | -4,78 | ||||
| 2026-02-17 | 13F | Northern Trust Corp | 815.066 | -3,73 | 76.706 | -8,36 | ||||
| 2026-02-17 | 13F | CWM Advisors, LLC | 0 | -100,00 | 0 | |||||
| 2026-01-12 | 13F | Rialto Wealth Management, LLC | 13 | -27,78 | 1 | 0,00 | ||||
| 2026-02-06 | 13F | Callahan Advisors, LLC | 3.000 | 0,00 | 282 | -4,73 | ||||
| 2026-02-10 | 13F | Sfmg, Llc | 9.883 | 0,15 | 930 | -4,62 | ||||
| 2026-01-23 | 13F | Avion Wealth | 0 | -100,00 | 0 | |||||
| 2026-04-17 | 13F | HHM Wealth Advisors, LLC | 0 | -100,00 | 0 | |||||
| 2026-02-12 | 13F | Federation des caisses Desjardins du Quebec | 7.713 | 17,65 | 726 | 11,88 | ||||
| 2026-02-11 | 13F | Capital International Investors | 1.620.981 | 0,00 | 152.551 | -4,81 | ||||
| 2026-01-22 | 13F | Bfsg, Llc | 1.030 | 0,00 | 97 | -4,95 | ||||
| 2026-02-17 | 13F | Shelton Capital Management | 3.482 | 0,00 | 328 | -4,94 | ||||
| 2026-02-04 | 13F | Ameritas Advisory Services, LLC | 0 | -100,00 | 0 | |||||
| 2026-02-23 | 13F | Wealth Preservation Advisors, LLC | 4.489 | 422 | ||||||
| 2026-02-13 | 13F | First National Bank Of Omaha | 84.777 | 232,46 | 8.025 | 218,29 | ||||
| 2026-02-17 | 13F | Sagewood Asset Management LP | 2.156 | 203 | ||||||
| 2026-02-17 | 13F | RMB Capital Management, LLC | 37.330 | -1,08 | 3.513 | -5,82 | ||||
| 2026-02-17 | 13F | Aquatic Capital Management LLC | 17.530 | -8,90 | 1.650 | -13,30 | ||||
| 2026-02-12 | 13F | Quadrant Capital Group Llc | 6.539 | 11,28 | 615 | 6,03 | ||||
| 2026-04-07 | 13F | U.S. Capital Wealth Advisors, LLC | 6.940 | -12,55 | 642 | -13,94 | ||||
| 2026-02-13 | 13F | Arrowstreet Capital, Limited Partnership | 73.363 | -54,27 | 6.904 | -56,47 | ||||
| 2026-02-24 | 13F | MidFirst Bank | 4.226 | 398 | ||||||
| 2026-02-17 | 13F | Atom Investors LP | 46.199 | 4.348 | ||||||
| 2026-03-24 | 13F | Armis Advisers, LLC | 3.472 | 311 | ||||||
| 2026-02-17 | 13F | Jain Global LLC | 239.507 | 22.540 | ||||||
| 2026-02-17 | 13F | Optiver Holding B.V. | 0 | -100,00 | 0 | |||||
| 2026-02-09 | 13F | Jefferies Financial Group Inc. | 17.525 | 1.649 | ||||||
| 2026-02-10 | 13F | BKD Wealth Advisors, LLC | 3.499 | 0,00 | 329 | -4,64 | ||||
| 2026-02-17 | 13F | NorthRock Partners, LLC | 0 | -100,00 | 0 | |||||
| 2026-01-30 | 13F | State of New Jersey Common Pension Fund D | 25.039 | 7,92 | 2.356 | 2,75 | ||||
| 2026-02-13 | 13F | Ubs Asset Management Americas Inc | 259.909 | -0,68 | 24.460 | -5,46 | ||||
| 2026-02-17 | 13F | Summit Trail Advisors, Llc | 2.733 | 6,59 | 257 | 1,58 | ||||
| 2026-01-08 | 13F | NorthCrest Asset Manangement, LLC | 0 | -100,00 | 0 | |||||
| 2026-02-13 | 13F | Natixis | 114 | -98,33 | 11 | -98,52 | ||||
| 2026-02-17 | 13F | Algert Global Llc | 15.000 | 0,00 | 1 | 0,00 | ||||
| 2026-04-20 | 13F | Concurrent Investment Advisors, LLC | 0 | -100,00 | 0 | -100,00 | ||||
| 2026-02-19 | 13F | CI Private Wealth, LLC | 16.262 | 1.533 | ||||||
| 2026-02-13 | 13F | First Trust Advisors Lp | 1.037.531 | 17,70 | 97.642 | 12,03 | ||||
| 2026-02-13 | 13F | Manufacturers Life Insurance Company, The | 0 | -100,00 | 0 | |||||
| 2026-02-02 | 13F | Montag A & Associates Inc | 18.321 | 0,00 | 1.724 | -4,80 | ||||
| 2026-02-18 | 13F | Vident Advisory, LLC | 2.479 | -21,20 | 233 | -25,08 | ||||
| 2026-02-17 | 13F | ISAM Funds (UK) Ltd | 0 | -100,00 | 0 | -100,00 | ||||
| 2026-04-23 | 13F | Impact Partnership Wealth, LLC | 0 | -100,00 | 0 | |||||
| 2026-02-05 | 13F | Elyxium Wealth, LLC | 2 | 0 | ||||||
| 2026-02-13 | 13F | Treasurer of the State of North Carolina | 42.025 | -6,79 | 4 | -25,00 | ||||
| 2026-04-20 | 13F | State of Alaska, Department of Revenue | 9.857 | -1,70 | 1 | |||||
| 2026-02-05 | 13F | Peak Asset Management, LLC | 3.127 | -17,21 | 294 | -21,18 | ||||
| 2026-02-10 | 13F | Sivia Capital Partners, LLC | 2.512 | 236 | ||||||
| 2026-02-17 | 13F | Longaeva Partners L.P. | 86.192 | 8.112 | ||||||
| 2026-02-17 | 13F | United Capital Financial Advisers, Llc | 3.424 | -3,82 | 322 | -8,26 | ||||
| 2026-02-06 | 13F | Stieven Capital Advisors, L.P. | 246.300 | -0,24 | 23.179 | -5,05 | ||||
| 2026-04-23 | 13F | Oppenheimer Asset Management Inc. | 19.308 | 1.786 | ||||||
| 2026-02-17 | 13F | Canada Pension Plan Investment Board | 14.300 | 76,54 | 1.346 | 68,13 | ||||
| 2026-02-03 | 13F | Ethic Inc. | 0 | -100,00 | 0 | -100,00 | ||||
| 2026-01-28 | 13F | Universal- Beteiligungs- und Servicegesellschaft mbH | 38.593 | 6,42 | 3.632 | 1,28 | ||||
| 2026-02-17 | 13F | XTX Topco Ltd | 41.358 | 3.892 | ||||||
| 2026-02-17 | 13F | Utah Retirement Systems | 5.301 | 0,00 | 499 | -4,96 | ||||
| 2026-02-05 | 13F | Mainsail Asset Management, Llc | 3.591 | 1,10 | 338 | -3,99 | ||||
| 2026-01-15 | 13F | Nisa Investment Advisors, Llc | 1.727 | -0,17 | 163 | -5,26 | ||||
| 2026-02-05 | 13F | Dana Investment Advisors, Inc. | 19.693 | -0,84 | 1.853 | -5,60 | ||||
| 2026-04-13 | 13F | Wedge Capital Management L L P/nc | 40.235 | -20,86 | 3.723 | -22,20 | ||||
| 2026-02-17 | 13F | Royal Bank Of Canada | 92.447 | -24,33 | 8.701 | -27,97 | ||||
| 2026-04-22 | 13F | Spirepoint Private Client, Llc | 10.364 | 0,00 | 959 | -1,74 | ||||
| 2026-02-05 | 13F | Cambridge Investment Research Advisors, Inc. | 10.539 | 0,34 | 1 | -100,00 | ||||
| 2026-02-17 | 13F | Point72 Asset Management, L.P. | 35.565 | -93,52 | 3.347 | -93,83 | ||||
| 2026-02-06 | 13F | Vestmark Advisory Solutions, Inc. | 22.019 | 352,69 | 2.072 | 331,67 | ||||
| 2026-02-13 | 13F | Cutler Capital Management, LLC | 5.723 | 539 | ||||||
| 2026-02-10 | 13F | Savant Capital, LLC | 4.631 | 4,42 | 436 | -0,68 | ||||
| 2026-02-17 | 13F | Balyasny Asset Management Llc | 175.358 | 1.009,72 | 16.503 | 956,47 | ||||
| 2026-04-23 | 13F | Forum Financial Management, LP | 0 | -100,00 | 0 | |||||
| 2026-02-11 | 13F | Hughes Financial Services, LLC | 6 | -50,00 | 1 | -100,00 | ||||
| 2026-01-20 | 13F | Stratos Wealth Partners, LTD. | 2.600 | 245 | ||||||
| 2026-02-17 | 13F | Ancora Advisors, LLC | 279 | 26 | ||||||
| 2026-02-17 | 13F | D. E. Shaw & Co., Inc. | 0 | -100,00 | 0 | -100,00 | ||||
| 2026-04-07 | 13F | Central Pacific Bank - Trust Division | 2.222 | 46,96 | 206 | 44,37 | ||||
| 2026-02-05 | 13F | HFM Investment Advisors, LLC | 5 | 0,00 | 0 | |||||
| 2026-01-28 | 13F | HB Wealth Management, LLC | 17.916 | -1,00 | 1.686 | -5,76 | ||||
| 2026-02-12 | 13F | DRW Securities, LLC | 10.032 | 944 | ||||||
| 2026-01-21 | 13F | West Paces Advisors Inc. | 3.600 | -50,00 | 339 | -52,46 | ||||
| 2026-02-13 | 13F | OpenArc Corporate Advisory, LLC | 5.891 | 554 | ||||||
| 2026-02-05 | 13F | Richard Young Associates, Ltd. | 4.604 | 433 | ||||||
| 2026-04-24 | 13F | Oakworth Capital, Inc. | 2.122 | 0,00 | 196 | -1,51 | ||||
| 2026-02-17 | 13F | Advisory Services Network, LLC | 0 | -100,00 | 0 | |||||
| 2026-02-17 | 13F | Sciencast Management LP | 8.325 | 783 | ||||||
| 2026-02-13 | 13F | Public Employees Retirement Association Of Colorado | 8.493 | 99,27 | 1 | -100,00 | ||||
| 2026-02-13 | 13F | TFO USA Ltd | 23.625 | 0,00 | 2.223 | -4,80 | ||||
| 2026-02-10 | 13F | Mutual Of America Capital Management Llc | 113.859 | -6,94 | 10.715 | -11,42 | ||||
| 2026-02-12 | 13F | Jane Street Group, Llc | 7.759 | -94,13 | 730 | -94,41 | ||||
| 2026-02-13 | 13F | FJ Capital Management LLC | 813.033 | 54,00 | 76.515 | 46,59 | ||||
| 2026-01-28 | 13F | CAPROCK Group, Inc. | 5.086 | 479 | ||||||
| 2026-02-11 | 13F | Rise Advisors, LLC | 0 | -100,00 | 0 | |||||
| 2025-11-14 | 13F | Point72 Europe (London) LLP | 439 | 43 | ||||||
| 2026-04-23 | 13F | J.w. Cole Advisors, Inc. | 3.433 | 318 | ||||||
| 2026-02-12 | 13F | Jane Street Group, Llc | Call | 5.500 | 103,70 | 518 | 94,36 | |||
| 2026-02-17 | 13F | Hancock Whitney Corp | 3.831 | 33,44 | 361 | 27,21 | ||||
| 2026-04-16 | 13F | Flywheel Private Wealth LLC | 3.601 | 333 | ||||||
| 2026-02-17 | 13F | Trexquant Investment LP | 12.483 | 1.175 | ||||||
| 2026-02-17 | 13F | Css Llc/il | 6.320 | 595 | ||||||
| 2026-01-29 | 13F | Sanctuary Advisors, LLC | 5.827 | 7,81 | 548 | 2,62 | ||||
| 2026-01-29 | 13F | UMA Financial Services, Inc. | 0 | -100,00 | 0 | |||||
| 2026-01-30 | 13F | Torren Management, LLC | 730 | 69 | ||||||
| 2026-02-13 | 13F | Landscape Capital Management, L.l.c. | 0 | -100,00 | 0 | -100,00 | ||||
| 2026-02-13 | 13F | Mml Investors Services, Llc | 2.360 | 5,88 | 222 | 0,91 | ||||
| 2026-02-13 | 13F | Basswood Capital Management, L.l.c. | 107.184 | 0,00 | 10.087 | -4,81 | ||||
| 2026-02-18 | 13F | GWM Advisors LLC | 0 | -100,00 | 0 | |||||
| 2026-02-17 | 13F | Silvercrest Asset Management Group Llc | 92.447 | 15,39 | 8.700 | 9,85 | ||||
| 2026-04-15 | 13F | DAVENPORT & Co LLC | 3.159 | 292 | ||||||
| 2026-02-11 | 13F | Franklin Resources Inc | 1.623.728 | 0,98 | 152.809 | -3,88 | ||||
| 2026-04-20 | 13F | City State Bank | 150 | 0,00 | 14 | -7,14 | ||||
| 2026-04-06 | 13F | GAMMA Investing LLC | 2.111 | 7,43 | 195 | 5,98 | ||||
| 2026-02-13 | 13F | Cito Capital Group, LLC | 2.258 | 0,00 | 0 | |||||
| 2026-02-17 | 13F | Amundi | 4.883 | 460 | ||||||
| 2026-01-28 | 13F | Ruffer LLP | 32.661 | 3.078 | ||||||
| 2026-04-14 | 13F | Builder Investment Group Inc /adv | 2.422 | 0,00 | 224 | -1,32 | ||||
| 2026-02-13 | 13F | Southeast Asset Advisors Inc. | 0 | -100,00 | 0 | |||||
| 2026-02-17 | 13F | Mercer Global Advisors Inc /adv | 11.918 | 1.122 | ||||||
| 2026-02-17 | 13F | Occudo Quantitative Strategies Lp | 2.721 | 256 | ||||||
| 2026-02-11 | 13F | Ameritas Investment Partners, Inc. | 18.421 | -2,90 | 1.734 | -7,57 | ||||
| 2026-04-24 | 13F | Yousif Capital Management, Llc | 29.203 | -6,28 | 2.702 | -10,50 | ||||
| 2026-02-11 | 13F | O'shaughnessy Asset Management, Llc | 5.043 | -40,64 | 475 | -43,50 | ||||
| 2026-02-11 | 13F | BI Asset Management Fondsmaeglerselskab A/S | 0 | -100,00 | 0 | |||||
| 2026-02-17 | 13F | Tower Research Capital LLC (TRC) | 2.166 | -13,88 | 204 | -18,15 | ||||
| 2026-02-12 | 13F | JPL Wealth Management, LLC | 0 | -100,00 | 0 | |||||
| 2026-04-15 | 13F | Activest Wealth Management | 5 | 0 | ||||||
| 2026-01-14 | 13F | Pallas Capital Advisors LLC | 0 | -100,00 | 0 | |||||
| 2026-02-11 | 13F | TCTC Holdings, LLC | 1.200 | 0,00 | 113 | -5,08 | ||||
| 2026-02-13 | 13F | Mariner, LLC | 21.742 | -33,26 | 2.048 | -36,45 | ||||
| 2026-02-13 | 13F | Ieq Capital, Llc | 10.064 | -73,56 | 947 | -74,83 | ||||
| 2026-04-03 | 13F | Investors Research Corp | 11.347 | 0,00 | 1.050 | -1,69 | ||||
| 2026-02-17 | 13F | National Asset Management, Inc. | 2.311 | 217 | ||||||
| 2026-02-09 | 13F | Harbour Investments, Inc. | 720 | 68 | ||||||
| 2026-02-13 | 13F | Sei Investments Co | 343.812 | 7,99 | 32.356 | 2,80 | ||||
| 2026-02-13 | 13F | Wells Fargo & Company/mn | 87.068 | 3,69 | 8.194 | -1,31 | ||||
| 2026-02-17 | 13F | Abel Hall, LLC | 2.661 | 250 | ||||||
| 2026-02-10 | 13F | IFG Advisory, LLC | 2.700 | 254 | ||||||
| 2025-11-07 | 13F | Synovus Financial Corp | 69.652 | 6.887 | ||||||
| 2026-02-13 | 13F | Brant Point Investment Management Llc | 49.372 | 0,00 | 4.646 | -4,81 | ||||
| 2026-02-05 | 13F | Requisite Capital Management, LLC | 3.295 | -14,64 | 310 | -18,64 | ||||
| 2026-02-09 | 13F | Fisher Asset Management, LLC | 622.396 | 2,49 | 58.574 | -2,44 | ||||
| 2026-02-13 | 13F | Johnson Investment Counsel Inc | 0 | -100,00 | 0 | |||||
| 2026-02-09 | 13F | Quest Partners LLC | 5.432 | -9,45 | 511 | -13,83 | ||||
| 2026-01-15 | 13F | Allspring Global Investments Holdings, LLC | 1.155.073 | 3,14 | 108.843 | -1,29 | ||||
| 2026-04-21 | 13F | Red Tortoise LLC | 93 | 0,00 | 9 | 0,00 | ||||
| 2026-02-17 | 13F | Public Employees Retirement System Of Ohio | 46.167 | -2,00 | 4.345 | -6,72 | ||||
| 2026-02-13 | 13F | Barclays Plc | 166.465 | -9,27 | 15.666 | -13,63 | ||||
| 2026-01-28 | 13F | Trail Ridge Investment Advisors, LLC | 2.762 | 0,00 | 260 | -5,13 | ||||
| 2026-02-17 | 13F | PMC FIG Opportunities LLC | 19.647 | -7,38 | 1.849 | -11,87 | ||||
| 2026-02-17 | 13F | Russell Investments Group, Ltd. | 97.482 | -2,20 | 9.174 | -6,91 | ||||
| 2025-11-14 | 13F | Wolverine Trading, Llc | 3.460 | 344 | ||||||
| 2026-02-09 | 13F | Keating Financial Advisory Services, Inc. | 47 | 4 | ||||||
| 2026-04-23 | 13F | SJS Investment Consulting Inc. | 23 | 109,09 | 2 | 100,00 | ||||
| 2026-02-17 | 13F | Crawford Investment Counsel Inc | 0 | -100,00 | 0 | |||||
| 2026-02-17 | 13F | Capitolis Liquid Global Markets LLC | 32.674 | 3.075 | ||||||
| 2026-02-13 | 13F | Victory Capital Management Inc | 1.737.558 | -0,25 | 163.522 | -5,05 | ||||
| 2026-02-10 | 13F | Commonwealth Of Pennsylvania Public School Empls Retrmt Sys | 25.153 | -3,17 | 2.367 | -7,83 | ||||
| 2026-02-17 | 13F | Farringdon Capital, Ltd. | 0 | -100,00 | 0 | |||||
| 2026-04-17 | 13F | Leeward Investments, LLC - MA | 83.005 | -3,34 | 7.680 | -4,97 | ||||
| 2026-02-12 | 13F | Loomis Sayles & Co L P | 419.665 | 4,16 | 39.495 | -0,86 | ||||
| 2026-02-13 | 13F | Islay Capital Management, Llc | 4.097 | 386 | ||||||
| 2026-02-13 | 13F | Rafferty Asset Management, LLC | 88.696 | -16,95 | 8.347 | -20,95 | ||||
| 2026-02-12 | 13F | California Public Employees Retirement System | 169.558 | -0,35 | 15.957 | -5,15 | ||||
| 2026-02-17 | 13F | Twinbeech Capital Lp | 42.500 | 4.000 | ||||||
| 2026-02-06 | 13F | HighTower Advisors, LLC | 187.627 | -0,54 | 17.658 | -5,33 | ||||
| 2026-02-12 | 13F | Colonial Trust Advisors | 5.488 | -15,56 | 516 | -19,63 | ||||
| 2026-01-29 | 13F | Dunhill Financial, LLC | 2 | 0 | ||||||
| 2026-02-06 | 13F | FourThought Financial Partners, LLC | 2.544 | 5,78 | 239 | 0,84 | ||||
| 2026-02-17 | 13F | Dark Forest Capital Management Lp | 0 | -100,00 | 0 | -100,00 | ||||
| 2026-02-10 | 13F | Eurizon Capital SGR S.p.A. | 843 | 80 | ||||||
| 2026-04-24 | 13F | Deprince Race & Zollo Inc | 728.548 | 346,00 | 67.405 | 338,46 | ||||
| 2026-02-18 | 13F | Crusonia Wealth Advisors LLC | 4.757 | 448 | ||||||
| 2026-02-17 | 13F | Millennium Management Llc | 91.824 | -91,11 | 8.642 | -91,53 | ||||
| 2026-04-24 | 13F | Key FInancial Inc | 58 | 0,00 | 5 | 0,00 | ||||
| 2026-01-16 | 13F | Trust Co Of Vermont | 650 | 0,00 | 61 | -4,69 | ||||
| 2026-02-06 | 13F | Intrust Bank Na | 2.584 | 243 | ||||||
| 2026-02-05 | 13F | Qsemble Capital Management, LP | 4.755 | 447 | ||||||
| 2026-02-17 | 13F | Two Sigma Advisers, Lp | 0 | -100,00 | 0 | |||||
| 2026-02-10 | 13F | Td Asset Management Inc | 50.814 | 1,61 | 4.782 | -3,28 | ||||
| 2025-11-14 | 13F | Point72 Asia (Singapore) Pte. Ltd. | 49 | 5 | ||||||
| 2026-02-09 | 13F | William Blair Investment Management, Llc | 3.655 | 41,28 | 344 | 34,51 | ||||
| 2026-04-22 | 13F | Pictet Asset Management Holding SA | 16.154 | 6,75 | 1.495 | 4,92 | ||||
| 2026-02-12 | 13F | Continental Advisors Llc | 18.512 | 0,00 | 1.742 | -4,81 | ||||
| 2026-01-27 | 13F | Regions Financial Corp | 271.435 | 25.545 | ||||||
| 2026-01-28 | 13F | WPG Advisers, LLC | 14 | 1 | ||||||
| 2026-02-17 | 13F | Aster Capital Management (DIFC) Ltd | 0 | -100,00 | 0 | |||||
| 2026-02-11 | 13F | Deutsche Bank Ag\ | 14.952 | -81,66 | 1.407 | -82,55 | ||||
| 2026-02-10 | 13F | Bnp Paribas Arbitrage, Sa | 11.525 | -33,83 | 1.085 | -37,05 | ||||
| 2026-04-23 | 13F | Ferguson Shapiro LLC | 0 | -100,00 | 0 | |||||
| 2026-01-30 | 13F | NJ State Employees Deferred Compensation Plan | 0 | -100,00 | 0 | -100,00 | ||||
| 2026-02-11 | 13F | Los Angeles Capital Management Llc | 944 | 83 | ||||||
| 2026-02-13 | 13F | Smartleaf Asset Management LLC | 648 | -5,40 | 62 | -10,29 | ||||
| 2026-02-13 | 13F | Kennedy Capital Management, Inc. | 205.551 | 7,96 | 19.344 | 2,76 | ||||
| 2026-04-09 | 13F | Moody National Bank Trust Division | 12.102 | 0,00 | 1.120 | -1,67 | ||||
| 2026-02-11 | 13F | Havemeyer Place LP | 1.232 | 116 | ||||||
| 2026-02-17 | 13F | Fmr Llc | 1.646.066 | -24,91 | 154.911 | -28,53 | ||||
| 2026-02-11 | 13F | Cerity Partners LLC | 11.445 | -10,42 | 1.077 | -14,73 | ||||
| 2026-02-17 | 13F | Persistent Asset Partners Ltd | 7.016 | 660 | ||||||
| 2026-04-20 | 13F | Ronald Blue Trust, Inc. | 1.046 | 6,52 | 97 | 4,35 | ||||
| 2026-02-09 | 13F | Coldstream Capital Management Inc | 0 | -100,00 | 0 | |||||
| 2026-01-28 | 13F | Chicago Partners Investment Group LLC | 3.308 | -6,74 | 331 | 4,09 | ||||
| 2026-02-05 | 13F | North Dakota State Investment Board | 3.545 | 334 | ||||||
| 2026-02-09 | 13F | Cary Street Partners Financial Llc | 3.032 | 285 | ||||||
| 2026-02-13 | 13F | Nfj Investment Group, Llc | 328.653 | 30.930 | ||||||
| 2026-02-04 | 13F | Securian Asset Management, Inc | 7.317 | -2,66 | 689 | -7,40 | ||||
| 2026-02-10 | 13F | Envestnet Asset Management Inc | 103.591 | -16,58 | 9.749 | -20,60 | ||||
| 2026-02-17 | 13F | Boothbay Fund Management, Llc | 48.449 | 4.560 | ||||||
| 2026-03-13 | 13F/A | Pensionmark Financial Group, Llc | 13.107 | 4,60 | 1.233 | -0,40 | ||||
| 2026-02-12 | 13F | Cloud Capital Management, LLC | 0 | -100,00 | 0 | |||||
| 2026-02-06 | 13F | Global Retirement Partners, LLC | 0 | -100,00 | 0 | |||||
| 2026-02-12 | 13F | Great Lakes Advisors, Llc | 12.237 | -31,58 | 1.152 | -34,90 | ||||
| 2026-02-17 | 13F | Raymond James Financial Inc | 85.461 | -36,53 | 8.043 | -39,59 | ||||
| 2026-02-11 | 13F | Capital World Investors | 620.509 | 0,00 | 58.396 | -4,81 | ||||
| 2026-04-07 | 13F | Signaturefd, Llc | 14.450 | 15,29 | 1.337 | 13,32 | ||||
| 2026-01-29 | 13F | Comerica Bank | 35.923 | -2,85 | 3.381 | -7,52 | ||||
| 2026-01-14 | 13F | ORG Partners LLC | 5 | -96,55 | 0 | -100,00 | ||||
| 2026-04-06 | 13F | Versant Capital Management, Inc | 982 | 129,44 | 91 | 125,00 | ||||
| 2026-04-22 | 13F | Fort Washington Investment Advisors Inc /oh/ | 337.045 | 55,37 | 31.183 | 52,75 | ||||
| 2026-02-13 | 13F | Charles Schwab Investment Management Inc | 1.180.502 | -0,77 | 111.097 | -5,54 | ||||
| 2026-04-06 | 13F | CX Institutional | 72 | 0 | ||||||
| 2026-04-10 | 13F | Perigon Wealth Management, LLC | 0 | -100,00 | 0 | |||||
| 2026-02-12 | 13F | CIBC Private Wealth Group, LLC | 46.826 | -0,64 | 4.407 | -5,43 | ||||
| 2026-01-29 | 13F | Quest 10 Wealth Builders, Inc. | 2 | 0,00 | 0 | |||||
| 2026-02-18 | 13F | Beacon Pointe Advisors, LLC | 22.892 | 2.154 | ||||||
| 2026-02-11 | 13F | Capital Research Global Investors | 1.576.502 | -5,68 | 148.365 | -10,22 | ||||
| 2026-04-17 | 13F | Brown, Lisle/cummings, Inc. | 20 | 2 | ||||||
| 2026-04-07 | 13F | Howard Financial Services, Ltd. | 16.149 | 0,00 | 1.494 | -1,65 | ||||
| 2026-02-13 | 13F | Colony Group, LLC | 22.875 | 2.153 | ||||||
| 2026-02-12 | 13F | Xponance, Inc. | 9.296 | -17,30 | 875 | -21,33 | ||||
| 2026-04-16 | 13F | Cornerstone Management, Inc. | 4.704 | 0,00 | 435 | -1,58 | ||||
| 2026-01-21 | 13F | Greenleaf Trust | 16.528 | 0,18 | 1.555 | -4,66 | ||||
| 2026-02-05 | 13F | Stephens Inc /ar/ | 2.165 | -54,74 | 204 | -56,99 | ||||
| 2026-02-17 | 13F | Jones Financial Companies Lllp | 503 | 0,20 | 47 | -6,00 | ||||
| 2026-02-05 | 13F | Gamco Investors, Inc. Et Al | 48.311 | -0,37 | 4.547 | -5,17 | ||||
| 2026-02-10 | 13F/A | Algebris (uk) Ltd | 522.594 | 199,36 | 49.204 | 185,31 | ||||
| 2026-04-17 | 13F | Fifth Third Wealth Advisors LLC | 38.072 | 0,97 | 3.522 | -0,73 | ||||
| 2026-02-12 | 13F | Bank Of Montreal /can/ | 241.165 | -10,38 | 22.925 | -13,83 | ||||
| 2026-02-09 | 13F | Hartland & Co., LLC | 367 | 2,80 | 35 | -2,86 | ||||
| 2026-02-13 | 13F | Panagora Asset Management Inc | 2.632 | 0,00 | 248 | -5,00 | ||||
| 2026-01-30 | 13F | Us Bancorp \de\ | 1.372 | -11,02 | 129 | -15,13 | ||||
| 2026-04-21 | 13F | GHP Investment Advisors, Inc. | 561 | 52 | ||||||
| 2026-02-17 | 13F | SageView Advisory Group, LLC | 3.872 | -2,74 | 364 | -7,38 | ||||
| 2026-04-13 | 13F | Mather Group, Llc. | 166 | 15 | ||||||
| 2026-02-12 | 13F | Nuveen, LLC | 378.901 | 10,63 | 35.658 | 5,30 | ||||
| 2026-02-13 | 13F | State Street Corp | 3.903.691 | -0,51 | 367.376 | -5,30 | ||||
| 2026-02-13 | 13F | Maltese Capital Management Llc | 187.000 | 31,23 | 17.599 | 24,91 | ||||
| 2026-01-07 | 13F | Corsicana & Co. | 1.200 | 113 | ||||||
| 2026-01-09 | 13F | Assenagon Asset Management S.A. | 0 | -100,00 | 0 | |||||
| 2026-02-19 | 13F | Atomi Financial Group, Inc. | 2.409 | -7,70 | 227 | -12,40 | ||||
| 2026-02-05 | 13F | Amalgamated Bank | 44.776 | -3,00 | 4 | 0,00 | ||||
| 2026-02-13 | 13F | Neuberger Berman Group LLC | 2.581 | 2,99 | 243 | -2,02 | ||||
| 2026-01-29 | 13F | Vanguard Group Inc | 10.937.359 | 1,50 | 1.029.315 | -3,38 | ||||
| 2026-04-16 | 13F | SG Americas Securities, LLC | 10.520 | -93,12 | 1 | -100,00 | ||||
| 2026-01-22 | 13F | V-Square Quantitative Management LLC | 238 | 22 | ||||||
| 2026-02-09 | 13F | MTM Investment Management, LLC | 197 | 19 | ||||||
| 2026-02-17 | 13F | Man Group plc | 31.823 | 142,59 | 2.995 | 131,02 | ||||
| 2026-02-17 | 13F | Alliancebernstein L.p. | 233.703 | 21.994 | ||||||
| 2026-04-23 | 13F | Peregrine Capital Management Llc | 160 | 15 | ||||||
| 2026-02-09 | 13F | Cary Street Partner Investment Advisory Llc | 64 | 6 | ||||||
| 2026-02-17 | 13F | Two Sigma Investments, Lp | 0 | -100,00 | 0 | -100,00 | ||||
| 2026-02-02 | 13F | Nicholas Hoffman & Company, LLC. | 16.527 | 0,68 | 1.555 | -4,19 | ||||
| 2026-02-13 | 13F | FORA Capital, LLC | 0 | -100,00 | 0 | |||||
| 2026-02-13 | 13F | Parkside Financial Bank & Trust | 3 | 0,00 | 0 | |||||
| 2026-02-13 | 13F | American Century Companies Inc | 1.840.552 | -0,87 | 173.215 | -5,65 | ||||
| 2026-02-12 | 13F | Mount Yale Investment Advisors, LLC | 22.019 | 352,69 | 2.072 | 331,67 | ||||
| 2026-04-17 | 13F | AdvisorNet Financial, Inc | 3 | 0 | ||||||
| 2026-01-28 | 13F | Kingswood Wealth Advisors, Llc | 2.322 | 219 | ||||||
| 2026-02-10 | 13F | Foundations Investment Advisors, LLC | 7.522 | 708 | ||||||
| 2026-02-10 | 13F | Machina Capital S.a.s. | 0 | -100,00 | 0 | |||||
| 2026-02-12 | 13F | Dimensional Fund Advisors Lp | 4.729.496 | 1,35 | 445.101 | -3,53 | ||||
| 2026-02-17 | 13F | Blair William & Co/il | 3.152 | -0,22 | 297 | -5,13 | ||||
| 2026-04-20 | 13F | Godsey & Gibb Associates | 120 | 0,00 | 11 | 0,00 | ||||
| 2026-02-10 | 13F | Angel Oak Capital Advisors, LLC | 8.000 | 53,85 | 753 | 46,30 | ||||
| 2026-02-12 | 13F | New York State Common Retirement Fund | 111.288 | 0,43 | 10.473 | -4,40 | ||||
| 2025-11-07 | 13F | Shell Asset Management Co | 125 | 0 | ||||||
| 2026-02-04 | 13F | Independent Advisor Alliance | 27.921 | -1,31 | 2.628 | -6,08 | ||||
| 2026-01-26 | 13F | Cwm, Llc | 19.047 | -58,27 | 2 | -75,00 | ||||
| 2026-02-11 | 13F | IMA Wealth, Inc. | 1 | 0,00 | 0 | |||||
| 2026-02-13 | 13F | Kestra Advisory Services, LLC | 0 | -100,00 | 0 | |||||
| 2026-02-12 | 13F | BlackRock, Inc. | 9.356.351 | -2,49 | 880.526 | -7,19 | ||||
| 2026-02-17 | 13F | Advisor Group Holdings, Inc. | 11.743 | 338,34 | 1.105 | 316,98 | ||||
| 2025-11-12 | 13F | CIBC Bancorp USA Inc. | 48.084 | 4.754 | ||||||
| 2026-02-17 | 13F | Adage Capital Partners Gp, L.l.c. | 223.800 | 0,00 | 21.062 | -4,82 | ||||
| 2026-01-26 | 13F | KBC Group NV | 3.146 | 0,00 | 0 | |||||
| 2026-01-27 | 13F | Evergreen Capital Management Llc | 4.401 | -19,85 | 414 | -23,62 | ||||
| 2026-02-10 | 13F | CIBC World Markets Inc. | 5.743 | 540 | ||||||
| 2026-02-13 | 13F | Rhumbline Advisers | 259.105 | -3,64 | 24.384 | -8,28 | ||||
| 2026-02-09 | 13F | Annis Gardner Whiting Capital Advisors, LLC | 4 | 100,00 | 0 | |||||
| 2026-02-13 | 13F | Icon Wealth Advisors, LLC | 3.398 | 0,65 | 320 | -4,20 | ||||
| 2026-02-03 | 13F | Sequoia Financial Advisors, LLC | 8.122 | 11,41 | 764 | 6,11 | ||||
| 2026-02-06 | 13F | Covestor Ltd | 886 | 80,82 | 0 | |||||
| 2026-02-11 | 13F | Parallel Advisors, LLC | 148 | -9,76 | 14 | -18,75 | ||||
| 2026-02-17 | 13F | Hanover Advisors Inc | 2.780 | 0,00 | 262 | -4,74 | ||||
| 2026-02-19 | 13F | Invesco Ltd. | 1.647.727 | 3,56 | 155.068 | -1,42 | ||||
| 2026-02-03 | 13F | F/M Investments LLC | 4.596 | 0,00 | 433 | -4,85 | ||||
| 2026-04-08 | 13F | Doliver Advisors, Lp | 4.382 | -6,88 | 405 | -8,37 | ||||
| 2026-02-10 | 13F | BW Gestao de Investimentos Ltda. | 125.005 | 11.764 | ||||||
| 2026-02-13 | 13F | Prudential Financial Inc | 21.163 | 28,37 | 1.992 | 22,22 | ||||
| 2026-04-13 | 13F | Cyndeo Wealth Partners, LLC | 22.062 | 0,00 | 2.041 | -1,69 | ||||
| 2026-02-02 | 13F | Fifth Third Bancorp | 1.085 | 2,55 | 102 | -1,92 | ||||
| 2026-04-09 | 13F | Wedmont Private Capital | 2.855 | 2,00 | 277 | 2,59 | ||||
| 2026-04-13 | 13F | Massmutual Trust Co Fsb/adv | 382 | -25,10 | 35 | -25,53 | ||||
| 2026-04-23 | 13F | CBOE Vest Financial, LLC | 73.246 | 17,06 | 6.777 | 15,08 | ||||
| 2026-02-13 | 13F | Caitong International Asset Management Co., Ltd | 0 | -100,00 | 0 | |||||
| 2026-02-17 | 13F | Zurich Insurance Group Ltd/FI | 12.400 | 0,00 | 1.167 | -4,82 | ||||
| 2026-04-10 | 13F | Daytona Street Capital LLC | 11.200 | 0,00 | 158 | -2,48 | ||||
| 2026-04-21 | 13F | Vise Technologies, Inc. | 4.664 | 0,00 | 439 | 0,00 | ||||
| 2026-02-17 | 13F | Price T Rowe Associates Inc /md/ | 80.664 | 5,54 | 8 | 0,00 | ||||
| 2026-02-06 | 13F | EverSource Wealth Advisors, LLC | 1.012 | -61,49 | 95 | -63,32 | ||||
| 2026-02-11 | 13F | Commonwealth Retirement Investments LLC | 81 | 8 | ||||||
| 2026-04-20 | 13F | Louisiana State Employees Retirement System | 28.700 | 3,24 | 2.655 | 1,49 | ||||
| 2026-01-27 | 13F | Zurcher Kantonalbank (Zurich Cantonalbank) | 31.593 | 12,38 | 2.973 | 6,98 | ||||
| 2026-02-05 | 13F | Northwestern Mutual Investment Management Company, Llc | 22.489 | -0,31 | 2.116 | -5,11 | ||||
| 2026-02-03 | 13F | Connable Office Inc | 6.326 | -3,73 | 595 | -8,32 | ||||
| 2026-01-29 | 13F | Ashton Thomas Private Wealth, LLC | 16.827 | 13,53 | 1.584 | 8,05 | ||||
| 2026-01-30 | 13F | Laurel Wealth Advisors LLC | 15.029 | 0,00 | 1.414 | -4,78 | ||||
| 2026-02-06 | 13F | Gsa Capital Partners Llp | 8.859 | 1 | ||||||
| 2026-02-09 | 13F | HBK Sorce Advisory LLC | 13.104 | -20,45 | 1.413 | -11,53 | ||||
| 2026-02-04 | 13F | Pacer Advisors, Inc. | 0 | -100,00 | 0 | |||||
| 2026-02-10 | 13F | CIBC Asset Management Inc | 3.151 | 0,00 | 297 | -4,82 | ||||
| 2026-04-10 | 13F | Oak Thistle LLC | 12.964 | 1.199 | ||||||
| 2026-02-17 | 13F | Wiley Bros.-aintree Capital, Llc | 2.369 | -25,76 | 223 | -29,52 | ||||
| 2026-02-10 | 13F | Axq Capital, Lp | 9.836 | 926 | ||||||
| 2026-01-28 | 13F | Klp Kapitalforvaltning As | 21.615 | 1,89 | 2.034 | -3,00 | ||||
| 2026-02-10 | 13F/A | Northwestern Mutual Wealth Management Co | 4.966 | 0,32 | 467 | -4,50 | ||||
| 2026-02-04 | 13F | First National Advisers, LLC | 8.999 | 32,87 | 847 | 26,46 | ||||
| 2026-02-03 | 13F | Crossmark Global Holdings, Inc. | 3.193 | -3,97 | 300 | -8,54 | ||||
| 2026-02-12 | 13F | Swiss National Bank | 199.530 | 1,42 | 18.778 | -3,46 | ||||
| 2026-02-13 | 13F | Aigen Investment Management, Lp | 3.878 | -33,74 | 365 | -37,02 | ||||
| 2026-02-03 | 13F | International Assets Investment Management, Llc | 24 | 2 | ||||||
| 2026-02-11 | 13F | Jpmorgan Chase & Co | 441.730 | 15,92 | 41.571 | 10,34 | ||||
| 2026-02-10 | 13F | Nomura Asset Management Co Ltd | 580 | 0,00 | 55 | -5,26 | ||||
| 2026-02-09 | 13F | Leavell Investment Management, Inc. | 2.370 | 0,64 | 223 | -3,88 | ||||
| 2026-02-10 | 13F | Principia Wealth Advisory, LLC | 4 | 33,33 | 0 | |||||
| 2026-02-17 | 13F | Magnetar Financial LLC | 25.579 | 251,50 | 2.407 | 234,77 | ||||
| 2026-01-27 | 13F | Brighton Jones Llc | 0 | -100,00 | 0 | |||||
| 2026-02-12 | 13F/A | KDK Private Wealth Management, LLC | 10.327 | 0,21 | 972 | -4,62 | ||||
| 2026-01-20 | 13F | SOA Wealth Advisors, LLC. | 87 | 1,16 | 8 | 0,00 | ||||
| 2026-02-05 | 13F | Atria Investments Llc | 3.636 | 342 | ||||||
| 2026-02-13 | 13F | Channing Capital Management, LLC | 107.538 | -5,15 | 10.120 | -9,71 | ||||
| 2026-02-11 | 13F | Meeder Advisory Services, Inc. | 4.433 | 417 | ||||||
| 2026-02-14 | 13F | Rockefeller Capital Management L.P. | 1.452 | -16,17 | 137 | -20,47 | ||||
| 2026-02-12 | 13F | Earnest Partners Llc | 1.269.587 | -5,98 | 119.481 | -10,51 | ||||
| 2026-02-13 | 13F | Prospector Partners Llc | 0 | -100,00 | 0 | |||||
| 2026-03-12 | 13F | Nalls Sherbakoff Group, Llc | 0 | -100,00 | 0 | |||||
| 2026-02-12 | 13F | Collier Financial | 756 | 0,53 | 71 | -4,05 | ||||
| 2026-02-11 | 13F | LPL Financial LLC | 24.348 | -0,29 | 2.291 | -5,10 | ||||
| 2026-02-13 | 13F | Advisory Research Inc | 47.285 | -1,22 | 4.450 | -5,98 | ||||
| 2026-02-17 | 13F | Pinnacle Financial Partners, Inc. | 70.458 | 6.631 | ||||||
| 2026-02-10 | 13F | Natixis Advisors, L.p. | 67.704 | -7,13 | 6 | -14,29 | ||||
| 2026-02-26 | 13F | Anchor Investment Management, LLC | 17.838 | 0,21 | 1.679 | -4,60 | ||||
| 2026-02-04 | 13F | Virginia Retirement Systems Et Al | 15.000 | -13,79 | 1.412 | -17,97 | ||||
| 2026-02-17 | 13F | Imprint Wealth LLC | 30 | 0,00 | 3 | 0,00 | ||||
| 2026-04-24 | 13F | Keybank National Association/oh | 5.810 | -2,24 | 538 | -3,94 | ||||
| 2026-04-24 | 13F | James Investment Research Inc | 6.835 | 0,15 | 632 | -1,56 | ||||
| 2026-02-09 | 13F | Catalyst Funds Management Pty Ltd | 19.800 | 0,00 | 1.863 | -4,80 | ||||
| 2026-04-23 | 13F | Marquette Asset Management, LLC | 19 | 0,00 | 2 | 0,00 | ||||
| 2026-02-12 | 13F | Callan Family Office, LLC | 2.503 | 236 | ||||||
| 2026-02-04 | 13F | Swiss Life Asset Management Ltd | 4.716 | 1,70 | 444 | -3,28 | ||||
| 2026-02-17 | 13F | Cetera Investment Advisers | 18.843 | 16,61 | 1.773 | 11,02 | ||||
| 2026-02-17 | 13F | Wellington Management Group Llp | 1.036.952 | 24,82 | 97.588 | 18,81 | ||||
| 2026-04-07 | 13F | Farther Finance Advisors, LLC | 393 | 97,49 | 37 | 100,00 | ||||
| 2026-01-29 | 13F | Quent Capital, LLC | 198 | 4,21 | 19 | 0,00 | ||||
| 2026-02-12 | 13F | Principal Securities, Inc. | 0 | -100,00 | 0 | -100,00 | ||||
| 2026-01-26 | 13F | Merit Financial Group, LLC | 0 | -100,00 | 0 | |||||
| 2026-02-17 | 13F | Qube Research & Technologies Ltd | 838.960 | 78.955 | ||||||
| 2026-02-09 | 13F | Smith Chas P & Associates Pa Cpas | 6.660 | 0,00 | 627 | -4,86 | ||||
| 2026-04-17 | 13F | Summit Wealth Partners, LLC | 8.805 | 0,00 | 815 | -1,69 | ||||
| 2026-04-09 | 13F | Red Spruce Capital, LLC | 36.257 | 0,12 | 3.354 | -1,58 | ||||
| 2026-01-29 | 13F | UBS Group AG | 568.441 | 23,51 | 53.496 | 17,56 | ||||
| 2026-01-29 | 13F | State Of Michigan Retirement System | 23.800 | -1,24 | 2.240 | -6,00 | ||||
| 2026-02-13 | 13F | Cullen Capital Management, LLC | 6.579 | -3,98 | 619 | -8,57 | ||||
| 2026-04-15 | 13F | Fortitude Family Office, LLC | 160 | 18,52 | 15 | 16,67 | ||||
| 2026-02-12 | 13F | Steward Partners Investment Advisory, Llc | 372 | -5,82 | 35 | -10,26 | ||||
| 2026-01-23 | 13F | Optima Capital Llc | 1 | 0 | ||||||
| 2026-01-21 | 13F | BIP Wealth, LLC | 30.612 | -0,03 | 2.881 | -4,86 | ||||
| 2026-02-06 | 13F | ProShare Advisors LLC | 4.029 | -6,41 | 379 | -10,82 | ||||
| 2026-01-14 | 13F | Hunter Perkins Capital Management, LLC | 35.367 | 0,00 | 3 | 0,00 | ||||
| 2026-04-23 | 13F | American National Bank | 0 | -100,00 | 0 | |||||
| 2026-02-09 | 13F | Minerva Advisors LLC | 5.661 | 0,00 | 533 | -4,83 | ||||
| 2026-02-13 | 13F | Baird Financial Group, Inc. | 2.955 | 9,28 | 278 | 4,12 | ||||
| 2026-04-24 | 13F | Strs Ohio | 168.902 | 124,73 | 15.627 | 120,92 | ||||
| 2026-02-05 | 13F | Allworth Financial LP | 0 | -100,00 | 0 | -100,00 | ||||
| 2026-02-06 | 13F | Pnc Financial Services Group, Inc. | 7.419 | -62,00 | 698 | -63,83 | ||||
| 2026-01-29 | 13F | Teachers Retirement System Of The State Of Kentucky | 29.971 | 0,00 | 3 | 0,00 | ||||
| 2026-04-16 | 13F | Capital Advisors, Ltd. LLC | 123 | -25,00 | 0 | |||||
| 2026-01-23 | 13F | Rsm Us Wealth Management Llc | 3.213 | -10,73 | 305 | -14,08 | ||||
| 2026-04-13 | 13F | Salem Investment Counselors Inc | 0 | -100,00 | 0 | |||||
| 2026-02-06 | 13F | Larson Financial Group LLC | 4 | 0 | ||||||
| 2026-01-29 | 13F | ProVise Management Group, LLC | 5.854 | 0,09 | 551 | -4,84 | ||||
| 2026-02-17 | 13F | Forest Hill Capital, LLC | 25.000 | 2.353 | ||||||
| 2026-01-29 | 13F | Verdence Capital Advisors LLC | 8.096 | 42,36 | 762 | 48,05 | ||||
| 2026-02-17 | 13F | Creative Planning | 44.886 | -16,15 | 4.224 | -20,18 | ||||
| 2026-02-13 | 13F | Bank Of Nova Scotia | 52.481 | 4.939 | ||||||
| 2026-02-17 | 13F | Warren Averett Asset Management, LLC | 18.765 | -6,00 | 1.766 | -10,49 | ||||
| 2026-04-22 | 13F | Janney Montgomery Scott LLC | 4.455 | 0,43 | 0 | |||||
| 2026-02-09 | 13F | Emerald Mutual Fund Advisers Trust | 0 | -100,00 | 0 | |||||
| 2026-02-17 | 13F | Aqr Capital Management Llc | 1.062.875 | -12,81 | 100.027 | -17,01 | ||||
| 2026-02-13 | 13F | JustInvest LLC | 10.021 | -4,29 | 943 | -8,89 | ||||
| 2026-04-13 | 13F | IFP Advisors, Inc | 892 | 0,00 | 83 | -1,20 | ||||
| 2026-02-13 | 13F | Umb Bank N A/mo | 1.649 | 155 | ||||||
| 2026-01-21 | 13F | Westfuller Advisors, LLC | 11 | 0,00 | 1 | 0,00 | ||||
| 2026-04-07 | 13F | Park Avenue Securities Llc | 4.660 | 14,81 | 0 | |||||
| 2026-02-13 | 13F | Marshall Wace, Llp | 0 | -100,00 | 0 | |||||
| 2026-02-12 | 13F | Ci Investments Inc. | 4.853 | 589,35 | 457 | |||||
| 2026-02-02 | 13F | Danske Bank A/s | 600 | 0,00 | 56 | -5,08 | ||||
| 2026-02-17 | 13F | Guggenheim Capital Llc | 48.450 | 4.560 | ||||||
| 2026-04-22 | 13F | Sterling Capital Management LLC | 3.897 | -40,82 | 361 | -41,84 | ||||
| 2026-04-24 | 13F | Root Financial Partners, LLC | 420 | 100,00 | 39 | 100,00 | ||||
| 2026-02-17 | 13F | Susquehanna International Group, Llp | Put | 22.200 | 2.089 | |||||
| 2026-02-17 | 13F | Susquehanna International Group, Llp | Call | 17.300 | 1.628 | |||||
| 2026-04-08 | 13F | DiNuzzo Private Wealth, Inc. | 12 | 9,09 | 1 | 0,00 | ||||
| 2026-02-17 | 13F | Susquehanna International Group, Llp | 15.089 | 1.420 | ||||||
| 2026-02-13 | 13F | Ingalls & Snyder Llc | 3.340 | -24,86 | 0 | |||||
| 2026-02-06 | 13F | CFO4Life Group, LLC | 5.506 | 0,38 | 518 | -4,43 | ||||
| 2026-02-12 | 13F | Commonwealth Equity Services, Llc | 10.143 | -7,70 | 955 | 95.300,00 | ||||
| 2026-02-17 | 13F | North Reef Capital Management LP | 90.000 | 8.470 | ||||||
| 2026-02-10 | 13F | Linscomb & Williams, Inc. | 15.309 | -2,24 | 1.441 | -6,98 | ||||
| 2026-02-02 | 13F | Principal Financial Group Inc | 216.137 | -3,81 | 20.341 | -8,44 | ||||
| 2026-02-12 | 13F | Brown Brothers Harriman & Co | 4.906 | -49,44 | 462 | -51,93 | ||||
| 2026-02-09 | 13F | Geode Capital Management, Llc | 1.866.033 | 4,83 | 175.653 | -0,21 | ||||
| 2026-02-13 | 13F | SRS Capital Advisors, Inc. | 182 | -98,78 | 17 | -98,84 | ||||
| 2026-02-12 | 13F | Ensign Peak Advisors, Inc | 6.286 | -62,03 | 592 | -63,88 | ||||
| 2026-02-03 | 13F | Carlson Capital L P | 9.700 | 19,75 | 913 | 14,00 | ||||
| 2026-02-17 | 13F | Freestone Grove Partners LP | 0 | -100,00 | 0 | |||||
| 2026-02-10 | 13F | New Mexico Educational Retirement Board | 20.000 | 0,00 | 2 | 0,00 | ||||
| 2026-01-27 | 13F | Tributary Capital Management, LLC | 11.644 | -1,85 | 1.096 | -6,57 | ||||
| 2026-02-04 | 13F | Oregon Public Employees Retirement Fund | 20.041 | -1,76 | 1.886 | -6,49 | ||||
| 2026-02-17 | 13F | Signature Equity Partners, LLC | 4 | 0 | ||||||
| 2026-02-13 | 13F | Quarry LP | 36 | 3 | ||||||
| 2026-04-23 | 13F | North Star Investment Management Corp. | 44 | 0,00 | 4 | 0,00 | ||||
| 2026-02-13 | 13F | Edgestream Partners, L.P. | 48.583 | -32,52 | 4.572 | -35,76 | ||||
| 2026-02-17 | 13F | T. Rowe Price Investment Management, Inc. | 824.498 | 78 | ||||||
| 2026-04-24 | 13F | Retirement Systems of Alabama | 265.456 | 0,34 | 24.560 | -1,35 | ||||
| 2026-01-30 | 13F/A | M&t Bank Corp | 3.829 | 43,14 | 360 | 36,36 | ||||
| 2026-01-26 | 13F | Nicholson Wealth Management Group, LLC | 7.111 | 0,00 | 669 | -4,84 | ||||
| 2026-02-17 | 13F | Select Equity Group, L.P. | 323.140 | -35,80 | 30.411 | -38,89 | ||||
| 2026-04-20 | 13F | Ritholtz Wealth Management | 3.701 | 342 | ||||||
| 2026-02-02 | 13F | Salzhauer Michael | 31.581 | 0,00 | 2.972 | 325,18 | ||||
| 2026-02-03 | 13F | Black Diamond Financial, LLC | 4.704 | 0,00 | 443 | -4,95 | ||||
| 2026-02-12 | 13F | State Board Of Administration Of Florida Retirement System | 13.215 | 0,00 | 1.244 | -4,82 | ||||
| 2026-02-11 | 13F | Tiaa Trust, National Association | 6.697 | 0,00 | 630 | -4,83 | ||||
| 2026-04-17 | 13F | Vermillion Wealth Management, Inc. | 5 | 0 | ||||||
| 2026-02-10 | 13F | Norges Bank | 1.338.219 | 125.940 | ||||||
| 2026-02-11 | 13F | Mill Capital Management, LLC | 2.439 | 0,00 | 230 | -4,98 | ||||
| 2026-02-18 | 13F | State of Tennessee, Treasury Department | 38.728 | 3.963 | ||||||
| 2026-02-17 | 13F | Captrust Financial Advisors | 31.661 | -1,30 | 2.980 | -6,05 | ||||
| 2026-02-11 | 13F | Buckingham Strategic Partners | 2.411 | -25,22 | 227 | -27,56 | ||||
| 2026-04-07 | 13F | Abacus Planning Group, Inc. | 2.286 | 0,00 | 212 | -1,86 | ||||
| 2026-04-15 | 13F | Weil Company, Inc. | 2.970 | 0,00 | 275 | -1,79 | ||||
| 2026-04-23 | 13F | Farmers & Merchants Investments Inc | 87 | 0,00 | 8 | 0,00 | ||||
| 2026-02-11 | 13F | 111 Capital | 0 | -100,00 | 0 | -100,00 | ||||
| 2026-02-13 | 13F | Verition Fund Management LLC | 532.971 | 40,04 | 50.158 | 33,29 | ||||
| 2026-02-17 | 13F | Holocene Advisors, LP | 321.500 | -48,52 | 30.256 | -51,00 | ||||
| 2026-02-17 | 13F | Janus Henderson Group Plc | 44.574 | 0,00 | 4.192 | -4,92 | ||||
| 2026-02-13 | 13F | Huber Capital Management LLC | 11.293 | 0,00 | 1.063 | -4,84 | ||||
| 2026-04-16 | 13F | Vaughan Nelson Investment Management, L.p. | 443.933 | 41.073 | ||||||
| 2026-02-02 | 13F | Truist Financial Corp | 90.144 | 0,12 | 8.483 | -4,71 | ||||
| 2026-02-12 | 13F | Johnson Financial Group, Inc. | 0 | -100,00 | 0 | |||||
| 2026-02-06 | 13F | Meiji Yasuda Asset Management Co Ltd. | 2.307 | -2,29 | 217 | -6,87 | ||||
| 2026-04-14 | 13F | Nbc Securities, Inc. | 5.877 | 0,43 | 544 | -1,27 | ||||
| 2026-04-13 | 13F | True Wealth Design, LLC | 141 | -23,37 | 13 | -23,53 | ||||
| 2026-02-12 | 13F | Wealthspire Advisors, LLC | 0 | -100,00 | 0 | |||||
| 2026-02-13 | 13F | Morgan Stanley | 1.579.164 | -11,12 | 148.615 | -15,40 | ||||
| 2026-01-30 | 13F | New York State Teachers Retirement System | 20.344 | 31,87 | 2 | 0,00 | ||||
| 2026-04-14 | 13F | Bay Harbor Wealth Management, LLC | 12 | 71,43 | 1 | |||||
| 2026-01-23 | 13F | Assetmark, Inc | 129 | 11,21 | 12 | 9,09 | ||||
| 2026-02-12 | 13F | Pitcairn Co | 0 | -100,00 | 0 | |||||
| 2026-02-13 | 13F | Ceredex Value Advisors LLC | 442.850 | 12,76 | 41.677 | 7,33 | ||||
| 2026-04-21 | 13F | Aaron Wealth Advisors LLC | 3.588 | -27,06 | 332 | -28,35 | ||||
| 2026-04-23 | 13F | TFC Financial Management | 502 | 0,60 | 46 | 0,00 | ||||
| 2026-04-16 | 13F | Sheets Smith Wealth Management | 6.471 | 0,11 | 599 | -1,64 | ||||
| 2026-02-10 | 13F | Keyes, Stange & Wooten Wealth Management, LLC | 2.274 | -13,96 | 214 | -18,01 | ||||
| 2026-03-03 | 13F/A | Integrated Investment Consultants, LLC | 3.869 | -0,03 | 364 | -4,71 | ||||
| 2026-01-28 | 13F | Teacher Retirement System Of Texas | 14.202 | -41,68 | 1.337 | -44,50 | ||||
| 2026-02-17 | 13F | California State Teachers Retirement System | 95.562 | -0,08 | 8.993 | -4,90 | ||||
| 2026-02-11 | 13F | Empowered Funds, LLC | 886 | 83 | ||||||
| 2026-02-03 | 13F | Mitsubishi UFJ Kokusai Asset Management Co., Ltd. | 285 | 0,00 | 27 | -7,14 | ||||
| 2026-02-17 | 13F | Tudor Investment Corp Et Al | 77.913 | 7.332 | ||||||
| 2026-02-12 | 13F | Voya Investment Management Llc | 55.988 | -12,30 | 5.269 | -16,52 | ||||
| 2026-02-06 | 13F | Handelsbanken Fonder AB | 29.438 | 27,78 | 3 | 0,00 | ||||
| 2026-02-11 | 13F | Peachtree Investment Partners, LLC | 3.575 | 0,00 | 336 | -4,82 | ||||
| 2026-02-10 | 13F | Measured Wealth Private Client Group, LLC | 513 | 0,00 | 48 | -4,00 | ||||
| 2026-04-20 | 13F | Jfs Wealth Advisors, Llc | 57 | 9,62 | 5 | 25,00 | ||||
| 2026-01-20 | 13F | Cromwell Holdings LLC | 16 | 100,00 | 2 | |||||
| 2026-02-03 | 13F | Cresta Advisors, Ltd. | 255 | 24 | ||||||
| 2026-02-17 | 13F | Brevan Howard Capital Management LP | 80.000 | 7.529 | ||||||
| 2026-02-24 | 13F | DGS Capital Management, LLC | 5.234 | 493 | ||||||
| 2026-02-10 | 13F | State of Wyoming | 1.096 | 92,28 | 103 | 83,93 | ||||
| 2026-01-28 | 13F | Salomon & Ludwin, LLC | 353 | 0,00 | 34 | -5,71 | ||||
| 2026-04-23 | 13F | MQS Management LLC | 2.580 | 239 | ||||||
| 2026-02-05 | 13F | Thrivent Financial For Lutherans | 102.043 | 190,06 | 10 | 200,00 | ||||
| 2026-02-17 | 13F | Westwood Holdings Group Inc | 1.050.659 | -17,91 | 98.878 | -21,87 | ||||
| 2026-02-17 | 13F | Ameriprise Financial Inc | 128.589 | -3,45 | 12.101 | -8,10 | ||||
| 2026-04-20 | 13F | Segment Wealth Management, LLC | 3.229 | 0,00 | 299 | -1,65 | ||||
| 2026-02-06 | 13F | Profund Advisors Llc | 3.310 | -1,02 | 312 | -5,76 | ||||
| 2026-01-28 | 13F | Arizona State Retirement System | 28.176 | -6,18 | 2.652 | -10,71 | ||||
| 2026-02-17 | 13F | Maryland State Retirement & Pension System | 4.874 | 0,00 | 459 | -4,78 | ||||
| 2026-04-15 | 13F | Seacrest Wealth Management, Llc | 6.665 | 0,00 | 617 | -4,20 | ||||
| 2026-02-13 | 13F | Alyeska Investment Group, L.P. | 4.808 | 452 | ||||||
| 2026-02-10 | 13F | Bank of New York Mellon Corp | 1.144.118 | 8,48 | 107.673 | 3,25 | ||||
| 2026-01-21 | 13F | Sound Income Strategies, LLC | 480 | 0,00 | 47 | 0,00 | ||||
| 2026-02-10 | 13F | Goldman Sachs Group Inc | 1.146.955 | 17,11 | 107.940 | 11,47 | ||||
| 2026-02-09 | 13F | Huntington National Bank | 853 | -2,63 | 80 | -6,98 | ||||
| 2026-02-12 | 13F | Federated Hermes, Inc. | 6.756 | -86,49 | 636 | -87,16 | ||||
| 2026-02-06 | 13F | Tortoise Investment Management, LLC | 0 | -100,00 | 0 | |||||
| 2026-01-21 | 13F | DMG Group, LLC | 0 | -100,00 | 0 | |||||
| 2026-02-10 | 13F | Rothschild Investment Llc | 487 | -82,58 | 46 | -83,70 | ||||
| 2026-04-23 | 13F | Private Wealth Management Group, LLC | 23 | -42,50 | 2 | -33,33 | ||||
| 2026-02-13 | 13F | Police & Firemen's Retirement System of New Jersey | 41.878 | -5,64 | 3.941 | -10,17 | ||||
| 2026-02-13 | 13F | Bragg Financial Advisors, Inc | 3.146 | -1,10 | 296 | -5,73 | ||||
| 2026-02-11 | 13F | Private Management Group Inc | 102.660 | 9.661 | ||||||
| 2026-02-12 | 13F | Caerus Investment Advisors, LLC | 0 | -100,00 | 0 | |||||
| 2026-02-13 | 13F | Segall Bryant & Hamill, Llc | 651.133 | -2,75 | 61.278 | -7,44 | ||||
| 2026-02-17 | 13F | State Of Wisconsin Investment Board | 173.479 | 10,86 | 16.326 | 5,53 | ||||
| 2026-02-17 | 13F | Hamilton Wealth, LLC | 4.230 | 94,21 | 424 | 97,21 | ||||
| 2026-02-13 | 13F | Stifel Financial Corp | 78.452 | 6,94 | 7.383 | 1,79 | ||||
| 2026-04-17 | 13F | First City Capital Management, Inc. | 4.801 | 0,00 | 444 | -1,55 | ||||
| 2026-02-13 | 13F | Pinnacle Wealth Planning Services, Inc. | 527 | 50 | ||||||
| 2026-01-21 | 13F | Newbridge Financial Services Group, Inc. | 141 | 0,00 | 13 | 0,00 | ||||
| 2026-02-13 | 13F | Fiduciary Trust Co | 4.172 | -8,41 | 393 | -12,89 | ||||
| 2026-02-13 | 13F | MAI Capital Management | 16.285 | 0,96 | 1.533 | -3,89 | ||||
| 2026-02-05 | 13F | Gabelli Funds Llc | 91.494 | 1,11 | 8.610 | -3,77 | ||||
| 2026-02-17 | 13F | Citadel Advisors Llc | 95.935 | -94,97 | 9.028 | -95,22 | ||||
| 2026-02-11 | 13F | Inceptionr Llc | 2.879 | 271 | ||||||
| 2026-02-17 | 13F | Citadel Advisors Llc | Put | 7.500 | 226,09 | 706 | 210,57 | |||
| 2026-02-17 | 13F | Citadel Advisors Llc | Call | 12.300 | 13,89 | 1.158 | 8,43 | |||
| 2026-02-20 | 13F | Kovitz Investment Group Partners, LLC | 0 | -100,00 | 0 | |||||
| 2026-04-02 | 13F | Ares Financial Consulting, LLC | 398 | 598,25 | 37 | 640,00 | ||||
| 2026-02-11 | 13F | SOUTH STATE Corp | 49.148 | 0,05 | 4.625 | -4,76 | ||||
| 2026-04-13 | 13F | Gateway Investment Advisers Llc | 6.268 | 580 | ||||||
| 2026-02-13 | 13F | Pathstone Holdings, LLC | 20.284 | -9,58 | 1.909 | -13,94 | ||||
| 2026-04-08 | 13F | Oliver Luxxe Assets LLC | 35.597 | 3.293 | ||||||
| 2026-04-15 | 13F | Trust Point Inc. | 5.295 | -5,98 | 490 | -7,74 | ||||
| 2026-02-17 | 13F | Bank Of America Corp /de/ | 718.531 | 16,19 | 67.621 | 10,59 | ||||
| 2026-02-05 | 13F | Bessemer Group Inc | 285.717 | 0,35 | 27 | -7,14 | ||||
| 2026-01-27 | 13F | First Horizon Corp | 813 | 27,83 | 77 | 22,58 | ||||
| 2026-02-12 | 13F | Rossby Financial, LCC | 5 | 0 | ||||||
| 2026-02-13 | 13F | Citigroup Inc | 86.656 | 9,18 | 8.155 | 3,93 |